Traceroute
The Trace Route utility records and displays the routing of data (the specific gateway computers at each hop) through the Internet between the subscriber’s gateway and a specified destination host.
This feature is supported by Broadcom based SmartRG gateways running firmware v2.6.2.1 and newer or SmartOS based gateways with firmware v10.8.x.x and newer. Also required is the latest plug-ins bundle installed on your Device Manager instance with base version 10.x or newer.
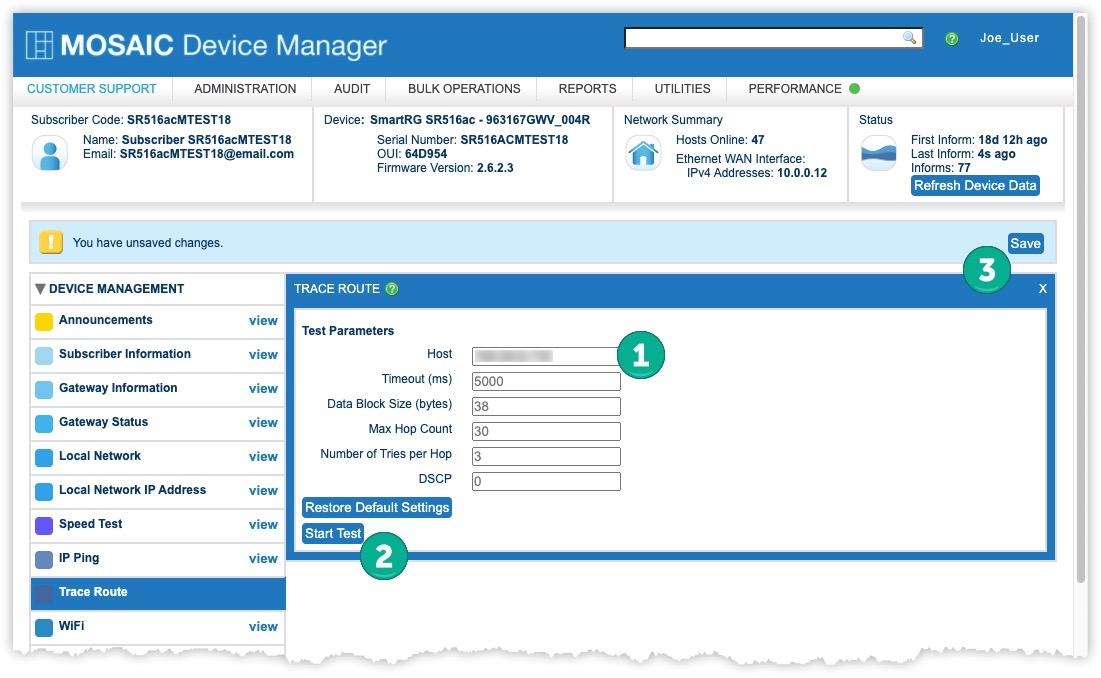
To access this feature, expand the Device Management section of the left navigation bar and select Trace Route.
Test Parameters
Definitions for each of the test parameters are available in the following table. All fields except Host are pre-populated with default values you can either accept or override.
| Test Parameter Name | Description |
| Host | Enter the host name or address of the host to find a route to |
| Timeout (ms) | If the test has not completed after this amount of time has expired, the test will stop. Expressed in Milliseconds, the default value for this parameter is 5000. |
| Data Block Size (bytes) | Size of the data block to be sent for each trace route. Expressed in bytes, the default value for this parameter is 38. |
| Max Hop Count | If the number of nodes along the trace exceeds this value, the test will stop. The default value for this parameter is 30 hops. |
| Number of Tries per Hop | The number of attempts the Trace Route tool will attempt to reach each node along the route. The default value for this parameter is 3 tries. |
| DSCP |
Enter the Differentiated Services Code Point (DSCP ) necessary for prioritization of this test. DSCP is a means of classifying and managing network traffic and providing quality of service (QoS). It inserts the 6-bit Differentiated Services (DS) field in the IP header for the purpose of packet classification. The valid range of values for DSCP is 0-63. The default value for this parameter is 0. Learn more about Differentiated Services here. |
Execute a Trace Route Test
- Enter a value for Host and modify any other necessary parameters. (See Test Parameter descriptions above.)
- Select the Start Test button
- Select the Save button near the upper-right.
View Trace Route Test Results
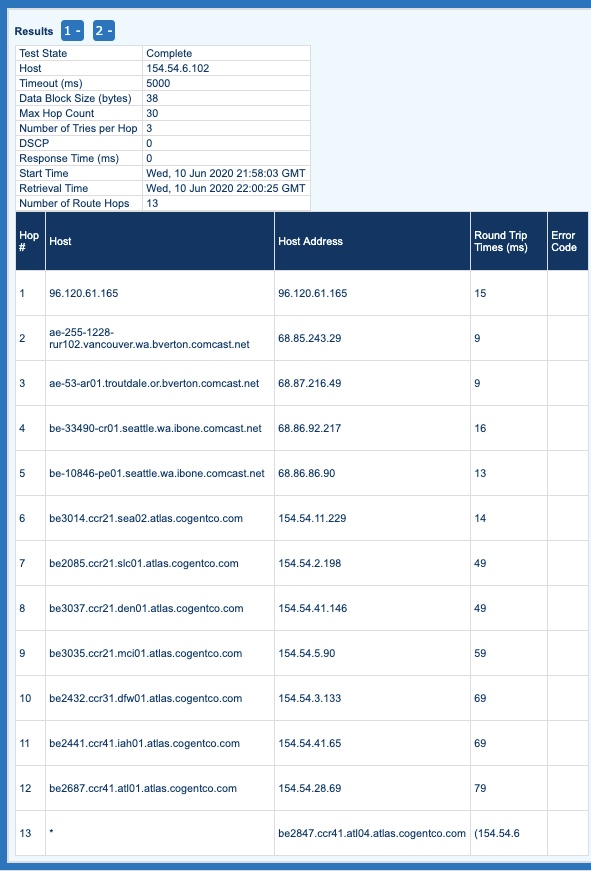
Once the results are displayed, the upper block shows a table with the Test Parameters used for that test. The wider table below is sorted sequentially by the Hop# with each line item displaying the specifics of that hop.
The columns that appear in the test output are described in the following table:
| Test Output Column Name | Description |
| Hop # | The hosts encountered during the trace are listed in sequential order. This column numbers each hop to indicate the order in which it was found. |
| Host | The description or IP address of the host encountered at a particular point (hop) along the trace. |
| Host Address | The IP address of the host encountered at a particular point (hop) along the trace. |
| Round Trip Times (ms) | The round trip time for the data block to be transmitted between the origin and this host located at this hop. (Expressed in milliseconds) |
| Error Code | In the event that this particular hop resulted in an error, a code # is presented. Error code values and their descriptions are available at www.iana.org. |
If multiple Trace Route tests have been run against this gateway device, Device Manager remembers results from up to 5 of the most recent tests. You can toggle the display to hide or show results from the various test by selecting the controls resembling the following:
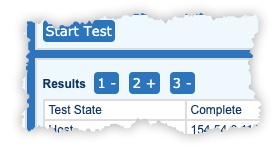
This example indicates that three Trace Route tests have been run against this gateway and the test results are available to be displayed. The second button 2+ indicates that the second test result set is currently hidden but can be revealed at will by selecting that 2+ button. Similarly, the first and third test result sets are currently displayed but can be temporarily hidden from view by selecting the 1- or the 3- buttons.