WAN Statistics (DOCSIS)
The WAN Statistics (DOCSIS) page displays full diagnostic information regarding the health of the subscriber’s line. In partnership with internet router technology companies, ADTRAN has answered the call of provider’s need to remotely access full band capture and related data remotely. This cutting edge presentation of the data now available via the CPE, renders obsolete the need for a field technician to be on site.
To begin, click the Gateway drop-down menu from the horizontal navigation bar at the top of the screen, then select WAN Statistics.
DOCSIS WAN Statistics Page
The following reviews the information available on this page from top to bottom.
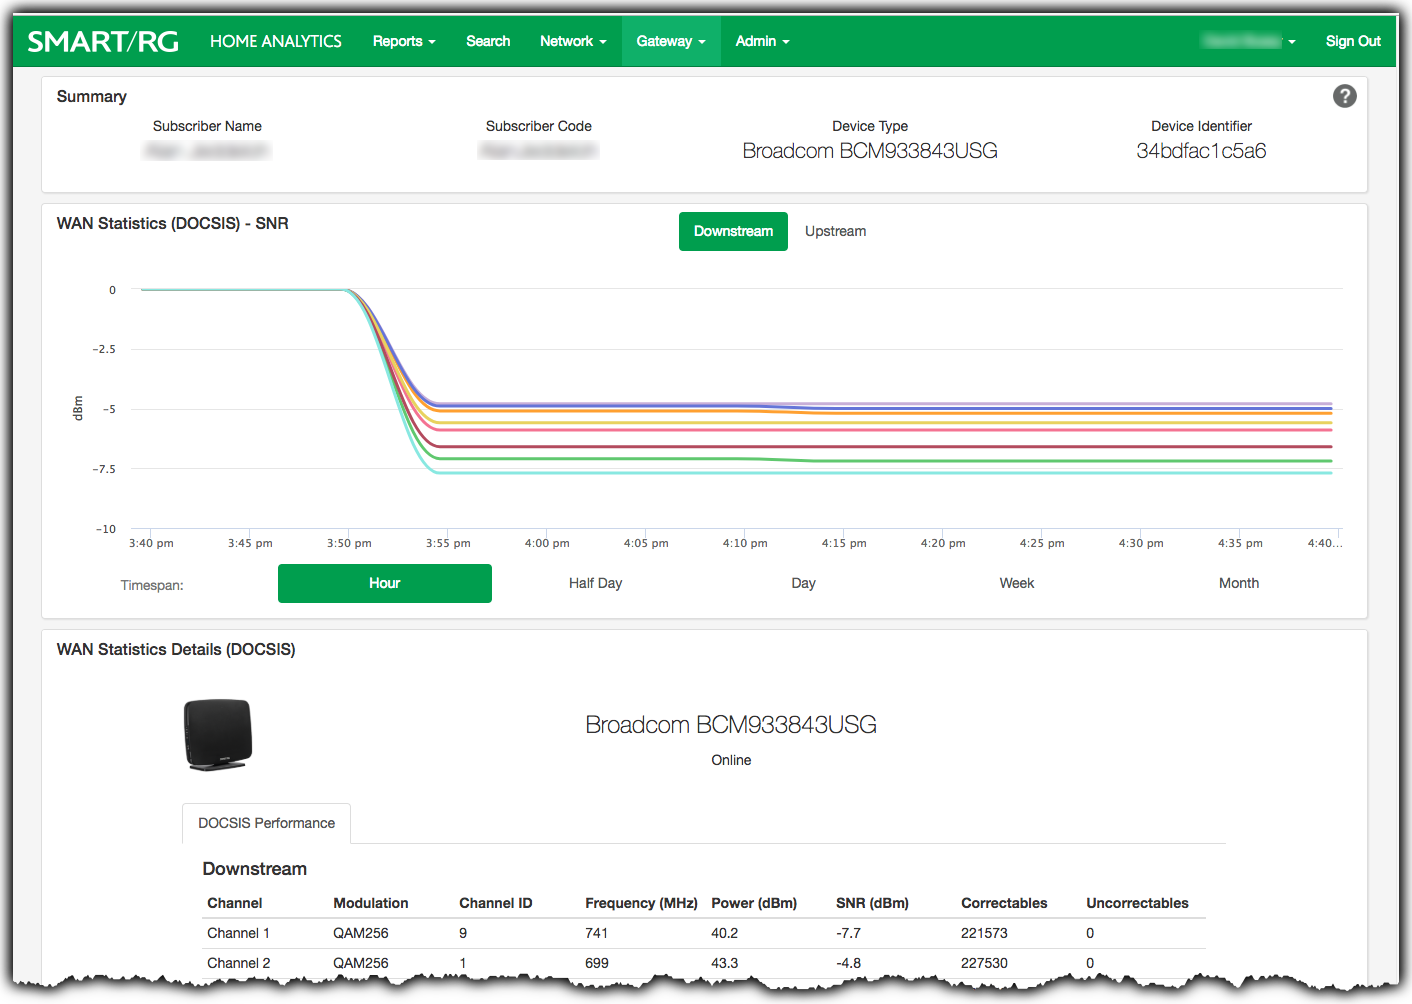
Summary Panel
The content of the top panel is a static display of the subscriber details including Subscriber Name, Subscriber Code, Device Type and Device Identifier. This panel remains constant no matter which page you navigate to and will update when you search for a different subscriber. This can be useful to confirm that you are looking at the correct gateway.
WAN Statistics (DOCSIS) - SNR Panel
This display provides a time series chart of the Signal To Noise Ratio (SNR) for each active channel on the subscriber’s device. Each color on the chart represents a different channel.
The default display shows downstream statistics. You may choose to display the upstream SNR instead. Just click the Upstream button positioned just above the chart.
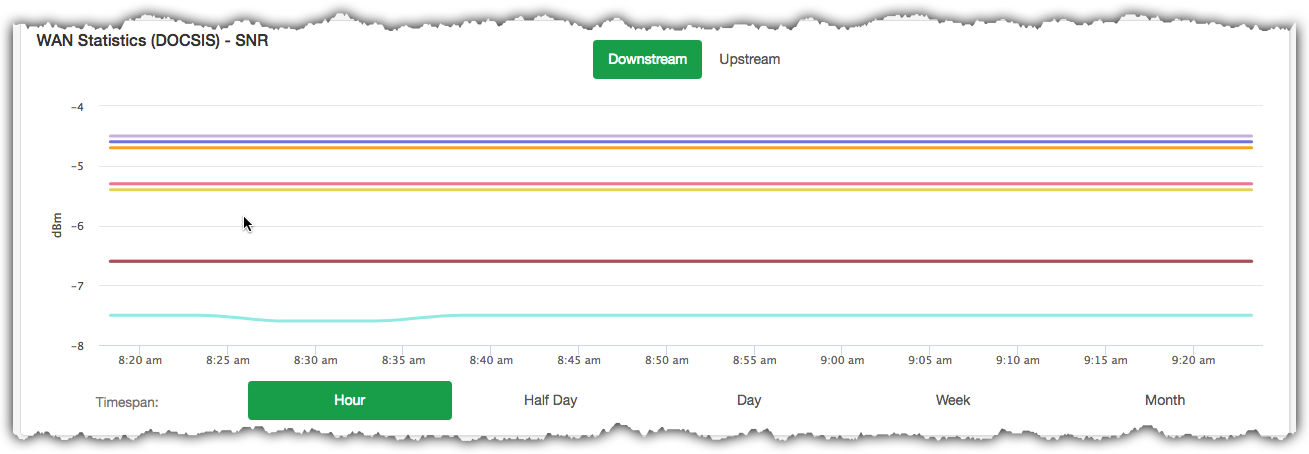
DOCSIS SNR Panel
Use your mouse anywhere along the timeline to reveal a tool tip for any channel. Displayed in the tool tip is SNR (measured in dBm) for that channel from a particular moment in time.
Use the Timespan buttons just below the chart to view statistical snapshots from different periods of time. Use the Month button to view an entire month of activity. Select Week, Day, Half Day, or Hour to zoom in and view the telemetry for lesser periods.
There is also a second method to zoom in and reveal detail for a shorter span of time. Click-and-drag your cursor across a portion of the chart. The chart zooms to fill the width of display with the time period you specified. Click Reset Zoom near the upper-right to return to the previous time span you selected using one of the Timespan buttons.
Using either method, any selected period representing less than 24 hours reveals 5 minute interval resolution -- the finest detail available from the platform.
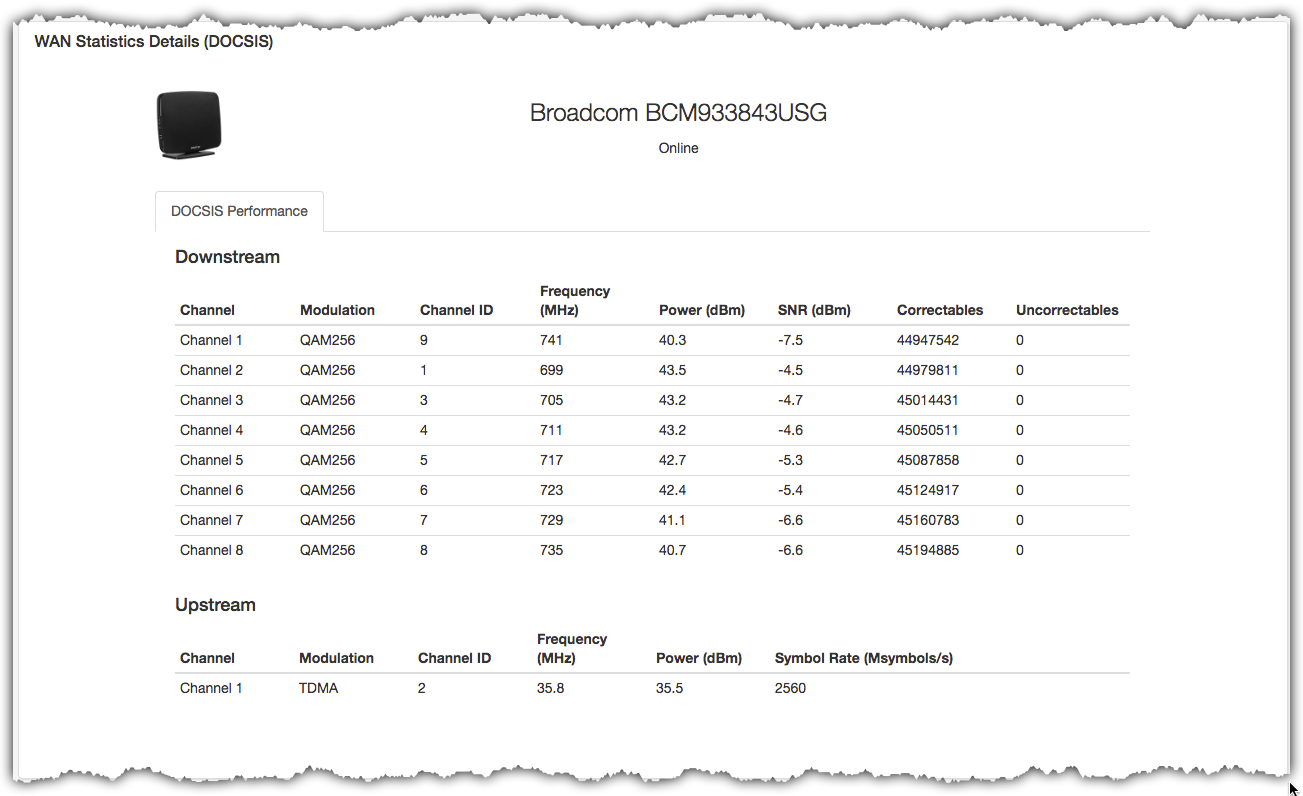
WAN Statistics Details (DOCSIS) Panel
The default display shows downstream statistics. You may choose to display the upstream SNR instead. Just click the Upstream button positioned just above the chart.
DOCSIS WAN Statistics Page
DOWNSTREAM
| COLUMN NAME | DESCRIPTION |
|---|---|
| Channel | An arbitrary index of the active channels currently configured on the CPE device. |
| Modulation | The bits per symbol rate being sent over the channel. |
| Channel ID | A numerical identifier for the channel. This is set by the CMTS. |
| Frequency (MHz) | The center point of the channel. (Expressed in megahertz.) |
| Power (dBm) | How much power is being received by the CPE device on the channel. |
| SNR (dBm) | The signal to noise ratio detected on the channel. |
| Correctables | The quantity of data errors occurred on the channel that were corrected. This counter is reset when the CPE device is power cycled or rebooted. |
| Uncorrectables | The quantity of data errors occurred on the channel that were unable to be corrected. This counter is reset when the CPE device is power cycled or rebooted. |
UPSTREAM
| COLUMN NAME | DESCRIPTION |
|---|---|
| Channel | An arbitrary index of the active channels currently configured on the CPE device. |
| Modulation | The method by which the modem is modulating the signal. Typically TDMA is the present day de facto standard. |
| Channel ID | A numerical identifier for the channel. This is set by the CMTS. |
| Frequency (MHz) | The center point of the channel. (Expressed in megahertz.) |
| Power (dBm) | How much power is being transmitted by the CPE device on the channel. |
| Symbol Rate | The baud rate of the channel. Symbol Rate times bits per symbol (derived from QAM) equals data rate. |
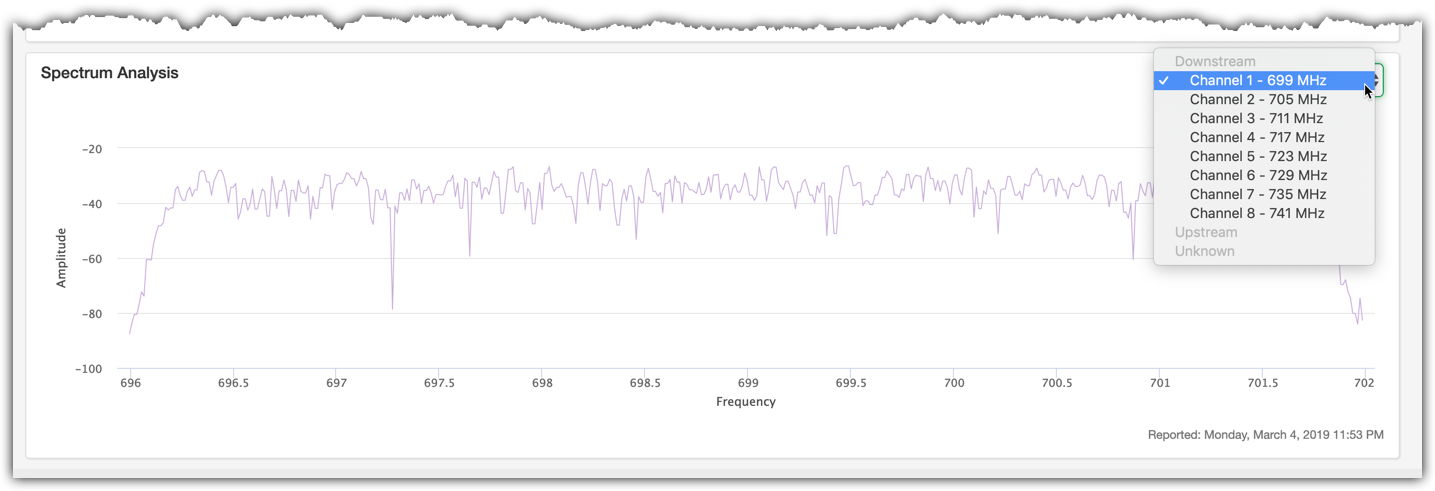
Spectrum Analysis Panel
The Spectrum Analysis displays the full band capture data available from the CPE and enables trained network personnel to identify the frequency space where conditions like excess noise or attenuation may be present.
Select the channel for which you wish to view the spectrum analysis by clicking the drop-down menu in the upper-right. Note the center frequency associated with the channel is displayed to the right of the channel number in this drop-down list.
DOCSIS WAN Statistics Page