WAN Statistics
The WAN Statistics page displays full diagnostic information from the G.992.5_Annex_A standard. This page currently supports DSL CPE devices only. The statistics are derived from the subscriber’s CPE device which is able to also provide some data from the local DSLAM to which it is connected. You may have other existing systems capable of providing some or all of this data. Provided here within the Mosaic Home Analytics platform helps make for a one-stop source for all relevant info about the state of the subscriber’s situation.
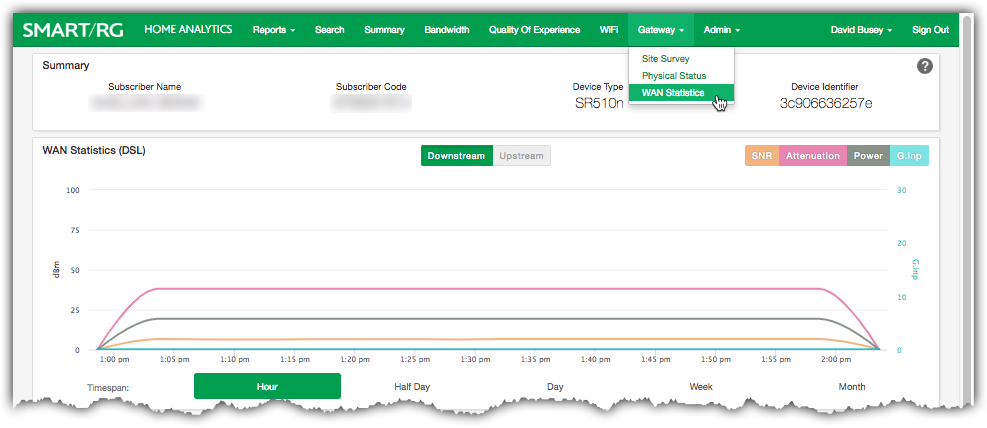
To begin, click the Gateway drop-down menu from the horizontal navigation bar at the top of the screen, then select WAN Statistics.
WAN Statistics Page
Summary Panel
The content of the top panel is a static display of the subscriber details including Subscriber Name, Subscriber Code, Device Type and Device Identifier. This panel remains constant no matter which page you navigate to and will update when you search for a different subscriber. This can be useful to confirm that you are looking at the correct gateway.
WAN Statistics (DSL) Panel
This upper portion of the screen provides core DSL performance information in a graphed format and includes the following statistics:
| STATISTIC | DESCRIPTION |
|---|---|
| SNR | Signal to Noise Ratio is a measurement of the Signal strength to the level of Noise on the line. The higher your SNR is better indicating the presence of less background noise. SNR is measured in Decibels (dBm). |
| Attenuation | Describes the reduction of the DSL signal strength that occurs over distance between the customer and the local exchange. Attenuation is measured in decibels (dBm). This number increases the further you are from the exchange as the signal loss increases. |
| Power | The power level of the DSL modem transmitting back toward the service provider. There is no Downstream power available because the transmit power is not known. Only downstream attenuation and SNR is available. |
| G.inp | The G.998.4 standard, otherwise known as G.inp, removes the leakage of signals in copper pairs caused by common household items. The standard is meant to improve impulse behavior generated from, “...any appliance with an electric motor, power switch or power adapter". Copper loops with poor shielding and/or improper grounding are the most…susceptible to this type of noise. This statistic displays the count of uncorrected G.inp errors. This count is displayed only when G.inp is enabled at the DSLAM. Also see, "Retransmission" below. |
These four stats can be turned on and off by clicking the buttons at the top-right of the chart. A grey button indicates that particular stat is not currently displayed.
Downstream and Upstream buttons (positioned just above the chart) re-purpose the display to show strictly the stats associated with the upstream link or the downstream link.
Hover your mouse over any point along the timeline to reveal the tooltip containing performance details from that moment in time.
Use the Timespan buttons just below the chart to view statistical snapshots from different periods of time. Use the Month button to view an entire month of activity. Select Week, Day, Half Day, or Hour to zoom in and view the telemetry for lesser periods.
There is also a second method to zoom in and reveal detail for a shorter span of time. Click-and-drag your cursor across a portion of the chart. The chart zooms to fill the width of display with the time period you specified. Click Reset Zoom near the upper-right to return to the previous time span you selected using one of the Timespan buttons.
Using either method, any selected period representing less than 24 hours reveals 5 minute interval resolution -- the finest detail available from the platform.
Outage Events
When Mosaic Home Analytics detects a WAN outage, it will be recorded and displayed on the time series chart described above. Each outage occurrence will appear as a "flag" consisting of a vertical, dotted, red line with a letter O (Outage) at the top of the dotted line.
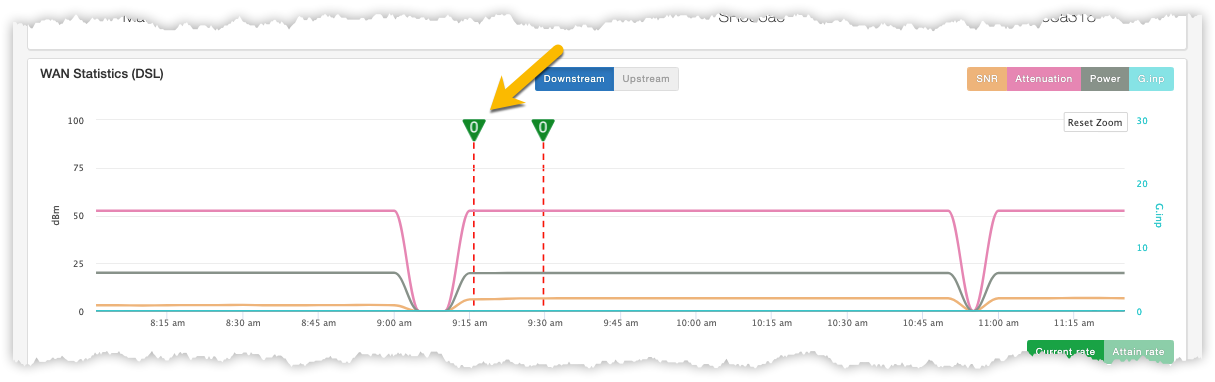
WAN outage events appear in the first time series chart
The times-stamp associated with the flag marks the time service was restored.
Current Rate and Attain Rate Time Series Chart
Placed immediately below the historical chart of SNR, Attenuation, Power and G.inp is a second time series chart revealing statistics for Current and Attain Rate over time.
Click the Attain Rate and Current Rate buttons placed above and to the right of this chart to re-purpose the display to exclusively show data for which the button is named.
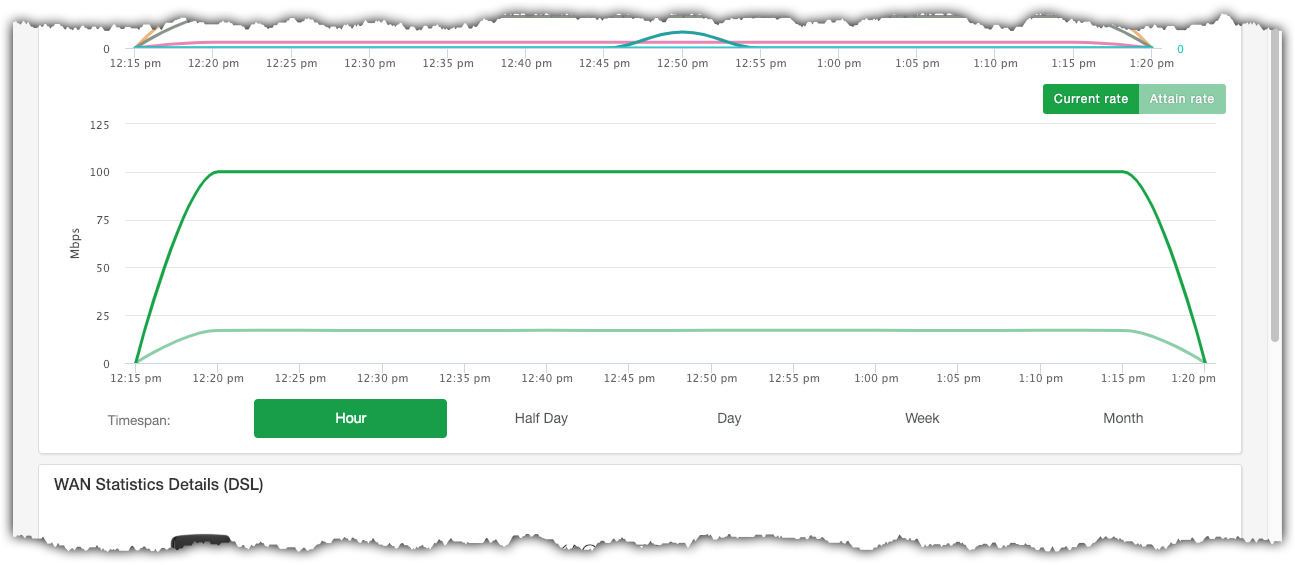
Historical Graphing of Current Rate and Attain Rate
DEFINITIONS
- Attain Rate: The max rate in kbps (upstream and downstream are separate) of the connection. This indicates the maximum rate of which the loop is capable.
- Current Rate: The present transfer rate in kbps, of the what the line is currently doing. Upstream and downstream rates are displayed separately.
Navigation
Hover your mouse over any point along the timeline to reveal the tooltip containing performance details from that moment in time.
Use the Timespan buttons just below the chart to view statistical snapshots from different periods of time. Use the Month button to view an entire month of activity. Select Week, Day, Half Day, or Hour to zoom in and view the telemetry for lesser periods.
There is also a second method to zoom in and reveal detail for a shorter span of time. Click-and-drag your cursor across a portion of the chart. The chart zooms to fill the width of display with the time period you specified. Click Reset Zoom near the upper-right to return to the previous time span you selected using one of the Timespan buttons.
Using either method, any selected period representing less than 24 hours reveals 5 minute interval resolution -- the finest detail available from the platform.
WAN Statistics Details (DSL) Panel
This lower portion of the screen displays detailed DSL statistics in a tabular format. The core stats available in the time series display are repeated here in these tables along with additional telemetry that can be used to assess the health of the subscriber’s line.
NOTE: All references to Upstream and Downstream are from the perspective of the managed gateway's position along the signal path. Therefore, upstream refers to data flow from the gateway toward the Internet. Downstream refers to the flow of data from the Internet toward the subscriber's gateway.
The tables reveal the following information:
Line n Status
| FIELD NAME | DESCRIPTION | |||
|---|---|---|---|---|
| Status | Indicates the status of the line. Possible values are Up or Down. | |||
| Standard |
Refers to the modulation/signaling employed on the loop. For example, there are multiple DSL standards. The reported value is from TR-098, InternetGatewayDevice.WANDevice.{i}.WAN- DSLInterfaceConfig.StandardsSupported, or equivalent table from TR-18, and reports the exact DSL variant in operation. Possible values include...
|
|||
| Traffic Type | Possible traffic types include ATM or PTM. This is dictated by the provider. | |||
| Link Power State | Indicate current link power state. Enumeration of L0 Full On, L2 Low Power, L3 Idle. | |||
| Retrains | An incrementing count of times line has retrained since the last reboot of the gateway. A high quantity of retrains would indicate a bad line. |
Line n Statistics
| STATISTIC | DESCRIPTION |
|---|---|
| Trellis | The state of the trellis encoding feature. Possible values are On or Off. |
| SNR | Signal to Noise Ratio is a measurement of the Signal strength to the level of Noise on the line. A higher SNR indicates the reduced presence of background noise. SNR is measured in Decibels (dBm). |
| Attenuation | Describes the reduction of the ADSL signal strength that occurs over distance between the customer and the local exchange. Attenuation is measured in decibels (dB). This number increases the further you are from the exchange as the signal loss increases. |
| Power | Upstream and downstream power expressed in Decibels (dBm). There is no Downstream power available because the transmit power is not known. Only downstream attenuation and SNR are available. |
| Attain Rate | The max rate in kbps (upstream and downstream are separate) of the connection. This indicates the maximum rate of which the loop is capable. |
| Current Rate | The present transfer rate in kbps, of the what the line is currently doing. Upstream and downstream rates are displayed separately. |
| Retransmission | The state of the G.inp retransmission setting at the DSLAM. Possible values are Enabled and Disabled. |
Line n Errors
| STATISTIC | DESCRIPTION |
|---|---|
| Frames | Total number of packets received. |
| Frame Errors | The number of packets received with an invalid frame checksum (FCS). This is often a physical issue (such as cabling or a faulty port) but can also indicate a duplex mismatch. |
| Bit Errors | The number of errored bits. It is possible to have more than one errored bit per frame. |
| HEC Errors | HEC is a type of CRC error check performed on the header of an ATM cell. A high concentration of HEC errors within a short period of time will negatively impact overall throughput and possibly cause connection instability. |
| Errored Secs | Errored Seconds keeps a counter when one or more coding violations occur or at least one Loss of Signal event occurred during a one second period of time. |
| SES | The Severely Errored Second counter tracks instances of 30% or more errored blocks or an occurrence of several other events such as one or more OOF taking place within a one second period. |
| RS Corrected | The number of Reed-Solomon code words with correctable errors wherein data was successfully recovered. |
| RS Uncorrected | The number of Reed-Solomon code words that had uncorrectable errors too severe to be corrected by FEC. |