Dashboard Report
To access the Dashboard, click on the Reports drop-down at the left of the horizontal menu bar then select Dashboard.
The Dashboard provides real-time, high-level information about all devices reporting to Mosaic Home Analytics. The row of tiles across the top displays averages and trends for the following:
- Connected Homes Total
- Quality of Experience (Average)
- Current Download Consumption (Average)
- LAN Devices WiFi Connected (Average)
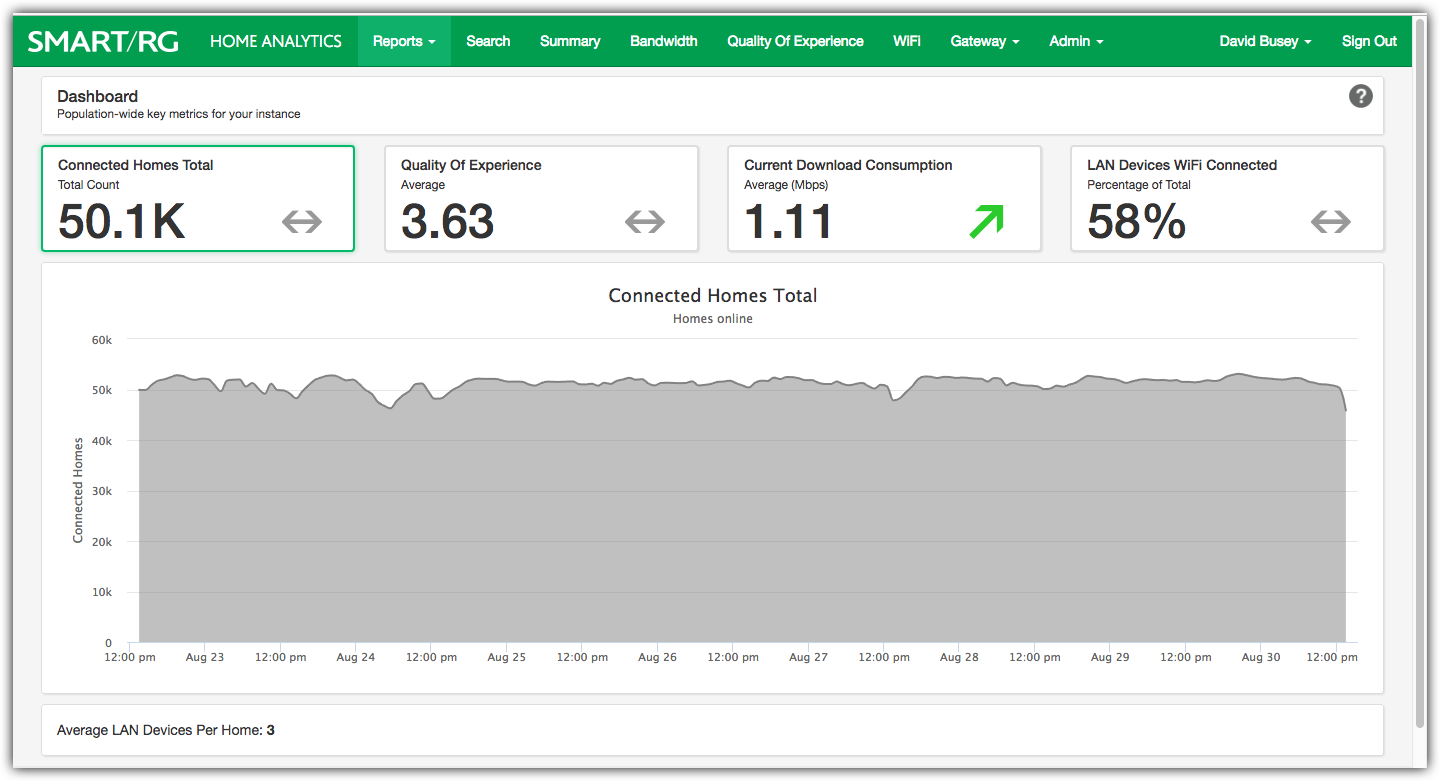
Click on a tile to display its time-series graphed data for that statistic in the space below. The time span for the graph displays one week of history.
In the example above, the graph shows the data for Current Download Consumption.
NOTE: To zoom in and see additional detail for a shorter span of time, click-and-drag your cursor across a portion of the chart. The chart zooms to fill the width of display with the time period you specified. To return to the default time span, click Reset Zoom.
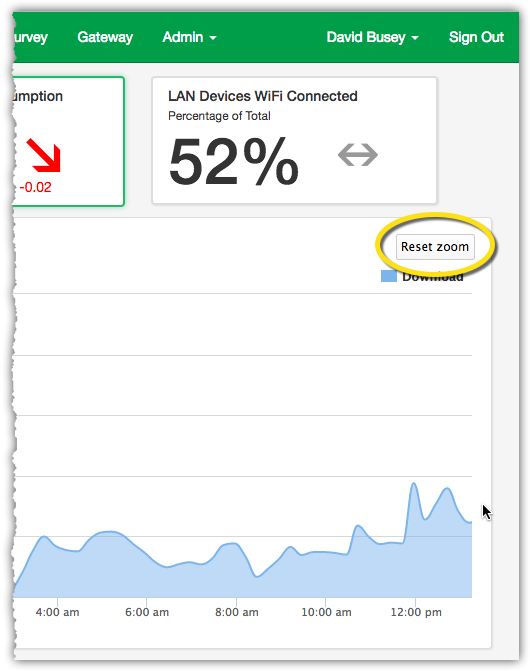
Reset Zoom button shows when zoomed to other than default timespan
Video Tutorial
RELATED ARTICLES: