Subscriber Quality of Experience
To access the Quality Of Experience page, click the Network drop-down menu at the top of the screen, then select Quality of Experience.
Quality Of Experience is an index of home internet performance created by ADTRAN, Inc. and takes into account the following metrics related to your subscriber’s internet experience:
- WiFi RSSI
- Free RAM
- Percent of CPU Utilization
- Device Uptime
This performance scale ranges from 0 to 5. A QoE rating of 5 would indicate perfect and optimal performance while a QoE rating of 0 would indicate very poor and potentially unusable performance.
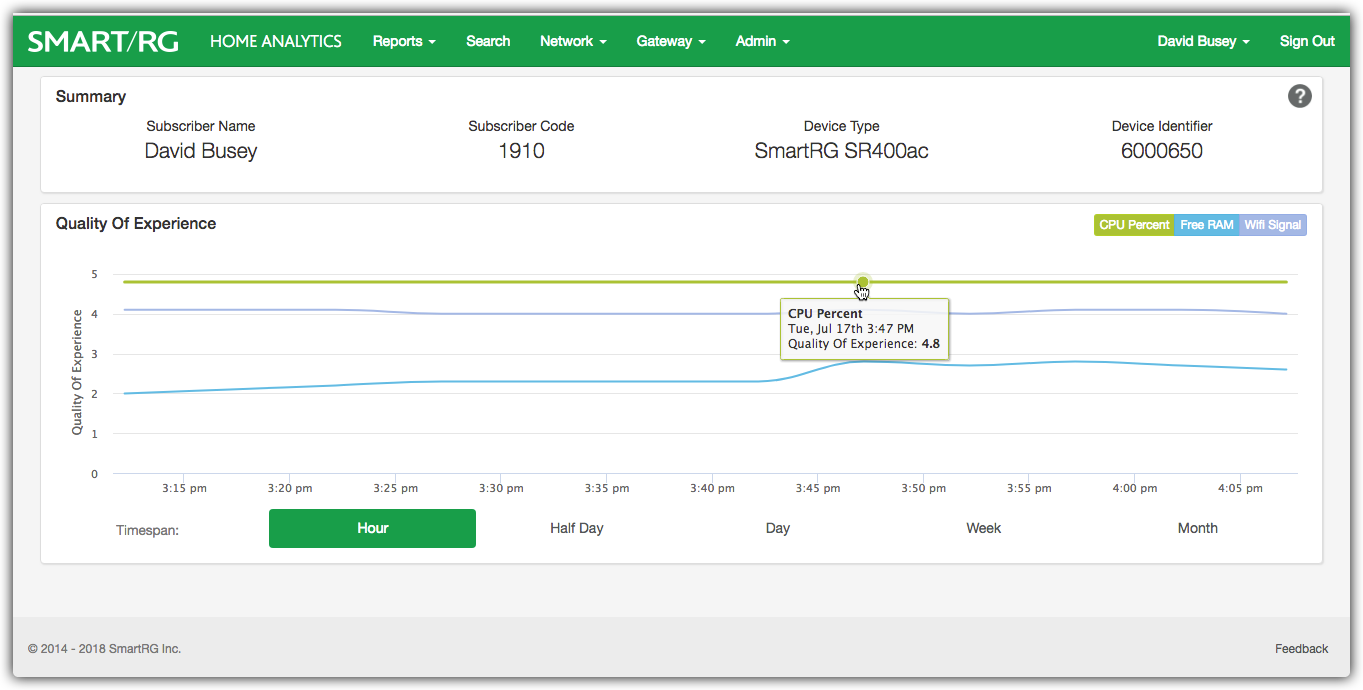
Quality of Experience Time Series Chart
Summary Panel
The content of the top panel is a static display of the subscriber details including Subscriber Name, Subscriber Code, Device Type and Device Identifier. This panel remains constant no matter which page you navigate to and will update when you search for a different subscriber. This can be useful to confirm that you are looking at the correct gateway.
Quality of Experience
This panel displays a timeline of the various metrics (listed above) that comprise a subscriber’s Quality of Experience. The QoE score is a numeric rating ranging from 0 to 5. A score of 0 indicates low, undesirable performance and a score of 5 reflects optimal performance.
Use the colored buttons in the upper right named for each metric to toggle these stats on or off.
Hover your mouse over any point along the timeline to reveal the tooltip containing performance details from that moment in time.
Use the Timespan buttons just below the chart to view statistical snapshots from different periods of time. Use the Month button to view an entire month of activity. Select Week, Day, Half Day, or Hour to zoom in and view the telemetry for lesser periods.
There is also a second method to zoom in and reveal detail for a shorter span of time. Click-and-drag your cursor across a portion of the chart. The chart zooms to fill the width of display with the time period you specified. Click Reset Zoom near the upper-right to return to the previous time span you selected using one of the Timespan buttons.
Using either method, any selected period representing less than 24 hours reveals 5 minute interval resolution -- the finest detail available from the platform.
Note that a composite QoE score is also charted on the Bandwidth page. WiFI RSSI is the most heavily weighted metric in deriving the QoE composite score. Other metrics are weighted significantly less in deriving the composite QoE score. See this article for more on how QoE is calculated.
Quality of Experience Details
The bottom panel of this page displays a table with an overview of the current statistics for each metric associated with Quality of Experience.
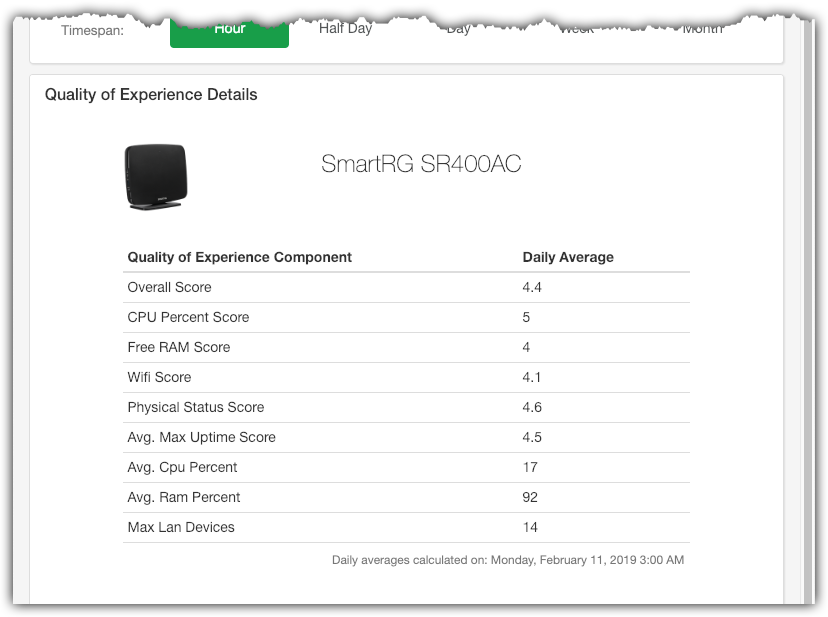
Quality of Experience Details
Definitions for the daily average statistics contained in the QoE Details table.
| Field Name | Description |
| Overall Score |
The weighted average of the QoE metrics tabulated for a single CPE device. More on how QoE is calculated is available in this article. |
| CPU Percent Score | The Quality of Experience Score for the percentage of CPU utilization on the subscriber's gateway. * |
| Free RAM Score | The Quality of Experience Score related to RAM utilization on the subscriber's gateway. * |
| WiFi Score | The Quality of Experience Score related to WiFi RSSI performance on the subscriber's gateway. * |
| Physical Status Score | A composite Quality of Experience Score for the metrics associated with the physical health of the subscriber's gateway. * |
| Avg. Max Uptime | Calculated from data captured from the last 13 reboots* of the device, this column displays the average time the device was up and functioning between these reboots. Learn more about Uptime tracking in this article. |
| Avg. CPU Percent | The average of gateway CPU utilization percentage over the past 24 hours. Learn more about Gateway Physical Health. |
| Avg. RAM Percent | The average of gateway RAM utilization percentage over the past 24 hours. Learn more about Gateway Physical Health. |
| Max LAN Devices | The quantity of unique LAN hosts active on the subscriber's gateway within the past 24 hours. |
* This performance scale ranges from 0 to 5. A QoE rating of 5 would indicate perfect and optimal performance while a QoE rating of 0 would indicate very poor and potentially unusable performance.
RELATED ARTICLES: