Assess The Physical Health Of The Gateway
To view the physical health of the gateway, Physical Status from the horizontal navigation bar at the top of the page.
Depending on your screen / browser window width, Physical Status may be found under the Gateway drop-down menu.
The Physical Status page provides a graphical depiction of the health of an individual subscriber’s gateway revealing the:
- RAM consumption
- CPU load
- Internal temperature (Only on specific gateway models that support this feature)
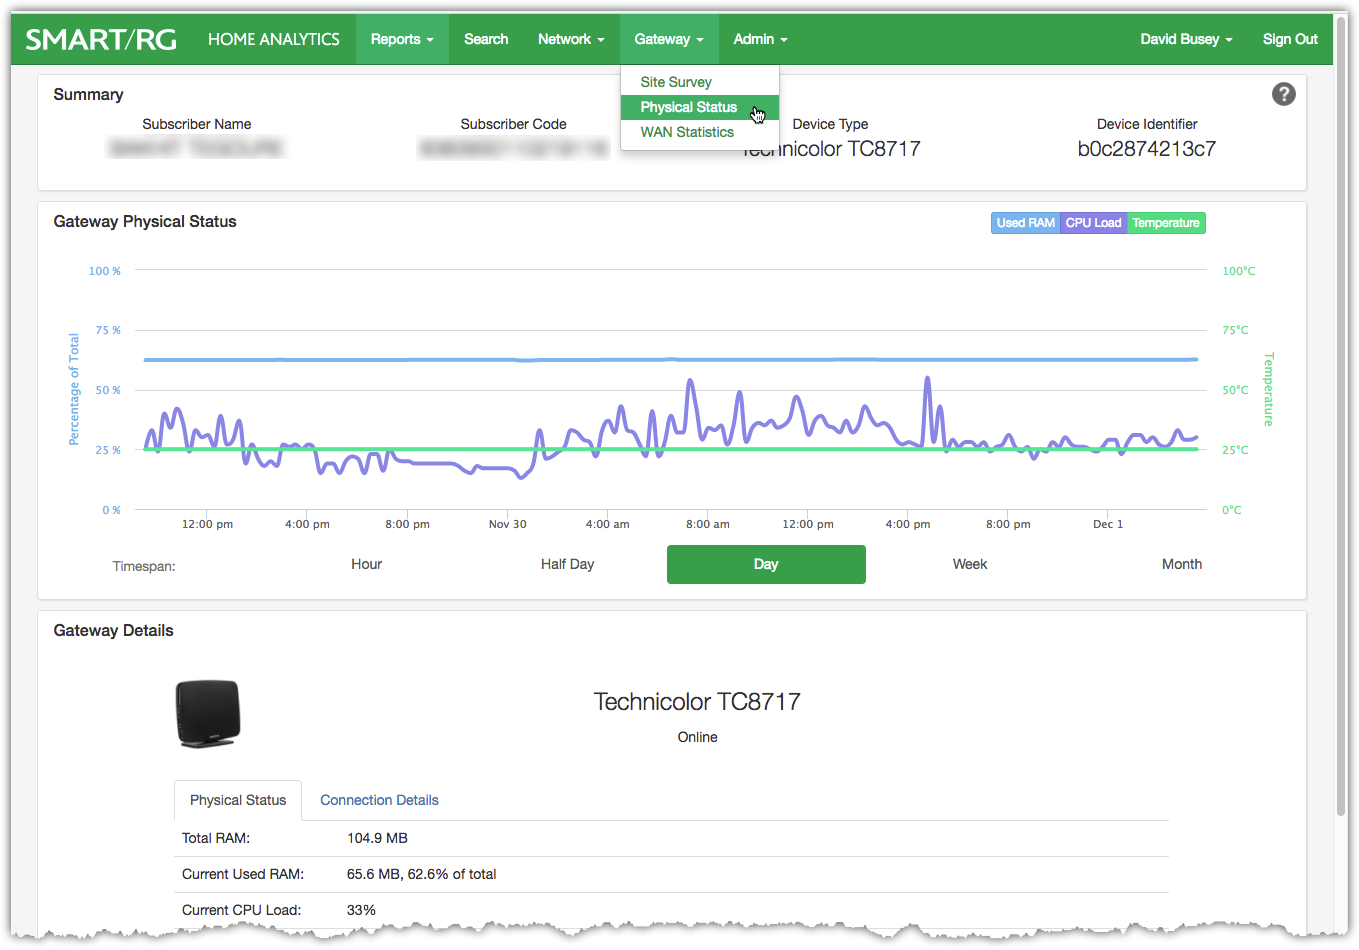
Gateway Physical Status Page
Summary Panel
The content of the top panel is a static display of the subscriber details including Subscriber Name, Subscriber Code, Device Type and Device Identifier. This panel remains constant no matter which page you navigate to and will update when you search for a different subscriber. This can be useful to confirm that you are looking at the correct gateway.
Gateway Physical Status
This panel contains the chart showing the three statistics noted above. Use the buttons in the upper right to toggle these stats on or off.
When unsupported by the device you are viewing, temperature data will be automatically toggled off and a tool tip stating, "No Data Available" appears when hovering over the dimmed temperature button. This is further reenforced down in the Device Details section where the Current Temperature line item simply states, "Temperature Not Available".
Hover your mouse over any point along the timeline to reveal the tooltip containing performance details from that moment in time.
If you notice any of these metrics have spiked or are sustained near the top of their respective ranges, you may choose to look back in time to discover when the elevated reading began. Using the Timespan buttons across the bottom of the screen, you’ll notice that you can see as far back as one month into the past.
If the timeframe when a significant rise took place coincides with the time that the performance complaint described by your subscriber began, you can ask the subscriber, or look for yourself on the bandwidth chart, and discover which device or devices may have caused unusual network traffic or usage.
The simplest way to resolve gateway CPU or RAM consumption problems is to reboot the gateway. The subscriber may have already attempted this so verify the date of the most recent reboot first. Just scroll down to the bottom of Gateway Details portion of the screen to confirm the "Last Reboot".
Reboot Events
When Mosaic Home Analytics detects that the CPE device has rebooted, it will be recorded and displayed on the time series chart described above. Each occurrence of a reboot will appear as a "flag" consisting of a vertical, dotted, red line with a letter B (reBoot) at the top of the line. Excessive frequency of a spontaneous CPE device reboots warrants investigation as it may indicate faulty software in need of an upgrade or possibly hardware failure requiring that the device be replaced.
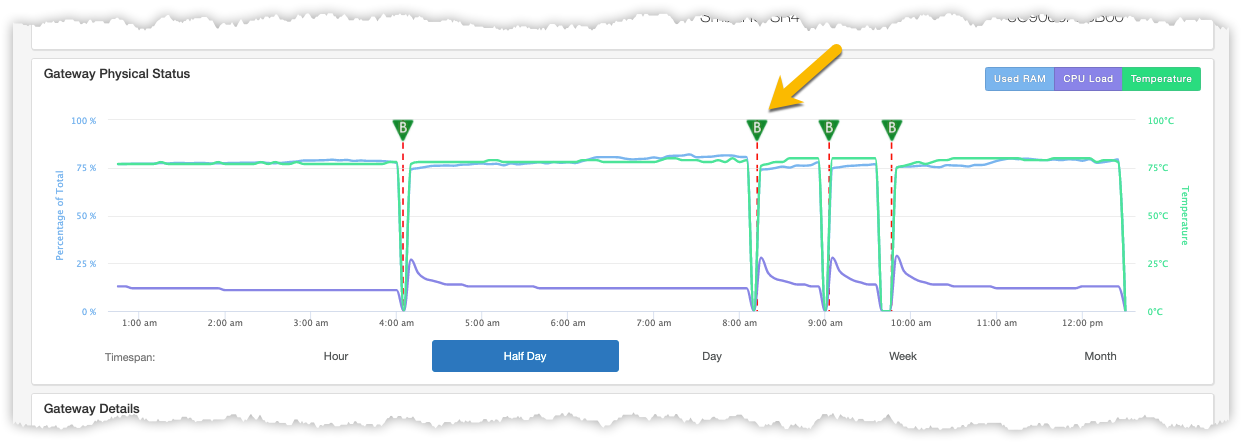
Reboot events appear in the first time series chart
The timestamp associated with the reboot is logged post-reboot; when the device comes online again. In the case where the device is offline for more than 15 minutes, the event is not considered a reboot and no reboot flag will be placed on the chart.
Gateway Details
The last panel shows the latest readings from the gateway for RAM consumption, CPU Load and Temperature along with additional facts and connection details related to the device.
Video Tutorial