Using The Bandwidth Page
To access the Bandwidth page, click on an individual Device tile from the Summary page or from the Network drop-down menu, select Bandwidth.
Summary Panel
The content of the top panel is a static display of the subscriber details including Subscriber Name, Subscriber Code, Device Type and Device Identifier. This panel remains constant no matter which page you navigate to and will update when you search for a different subscriber. This can be useful to confirm that you are looking at the correct gateway.
Bandwidth Use and Quality of Experience
The Bandwidth Use and Quality of Experience panel appears when you navigate to this page by selecting Bandwidth from the Network drop-down menu. This panel provides a time series chart showing the bandwidth consumption for LAN devices on this subscriber's network. In addition, a blue line in the graph charts the Quality of Experience for this subscriber.
Bandwidth Use
The bandwidth use for each LAN device will be displayed in the chart as a different shaded color. The display shows a span of time you specify.
Use the Timespan buttons just below the chart to view statistical snapshots from different periods of time. Use the Month button to view an entire month of activity. Select Week, Day, Half Day, or Hour to zoom in and view the telemetry for lesser periods.
There is also a second method to zoom in and reveal detail for a shorter span of time. Click-and-drag your cursor across a portion of the chart. The chart zooms to fill the width of display with the time period you specified. Click Reset Zoom near the upper-right to return to the previous time span you selected using one of the Timespan buttons.
Using either method, any selected period representing less than 24 hours reveals 5 minute interval resolution -- the finest detail available from the platform.
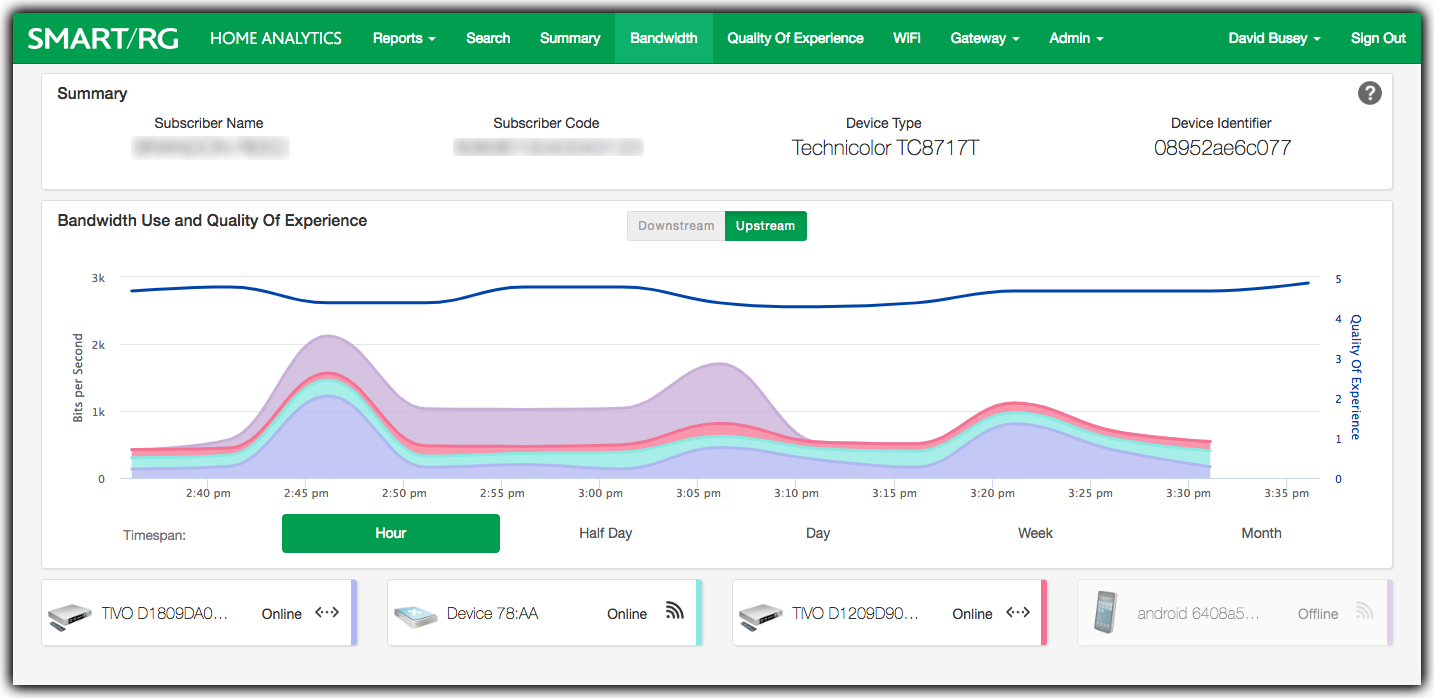
Bandwidth Landing Page - All LAN Devices
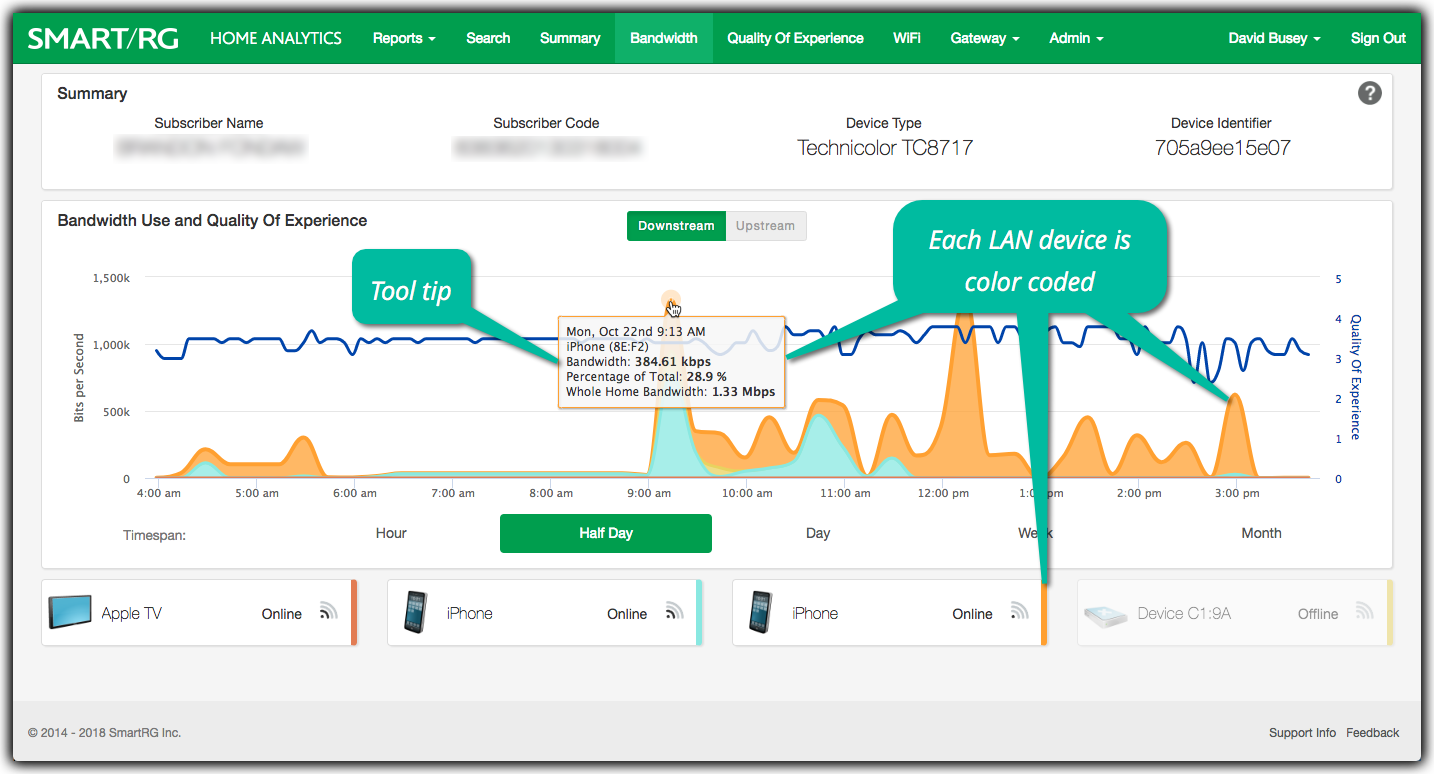
Reference the vertical legend at the left of the time series chart to interpret the amount of bandwidth being used by a specific device. For a greater precision reading, hover your cursor over a particular color on the chart. A tool tip will appear displaying the name of the LAN device represented by that color along with a date and timestamped reading of the actual bandwidth consumption and percent of total bandwidth for that device, during that moment in time.
The percent of total bandwidth is particularly helpful in quickly ascertaining if a particular device or devices is responsible for dominating available bandwidth. Knowledge of the contracted rate for this particular subscriber is needed to put this information into perspective.
LAN devices are color coded
LAN devices are color coded
LAN devices are color coded
Note that the outline of the tool tip changes color as you move around the chart. The color of this outline corresponds to the color at the right edge of the device's tile below to help you easily identify the breakdown of the data in the chart.
The default display shows Downstream usage. You may choose to display the upstream bandwidth consumption instead. Just click Upstream just above the chart.
You un-complicate the graph by clicking a specific tile. This will specialize the display for that single device and the title of the panel will change to Bandwidth Use and WiFi Signal.
Quality of Experience
The single, blue line spanning the display, charts the Quality of Experience (QoE) for this subscriber. See the legend to the right of the chart to get a sense of the subscriber Quality of Experience index over the selected timespan. For a greater precision reading, hover your cursor on the blue QoE line at a point of interest during the timespan displayed. A tool tip will appear displaying the date and time-stamped QoE reading logged for that moment in time.
You can learn more about Quality of Experience here and here.
Bandwidth Use and WiFi Signal
This panel appears when an individual LAN device is chosen. Click on either the color in the time series chart or on the tile below the chart representing the LAN device you'd like to examine more closely. You may click the x in the corner of the Device Details panel (see upper right corner of the image below) to revert the display to showing all LAN devices. The title for this panel then reverts to Bandwith Use and Quality of Experience (described above).
Especially for large networks, the view of all devices can be a bit distracting to look at. Leverage this view to simplify and study the past and present bandwidth consumption for a single LAN device.
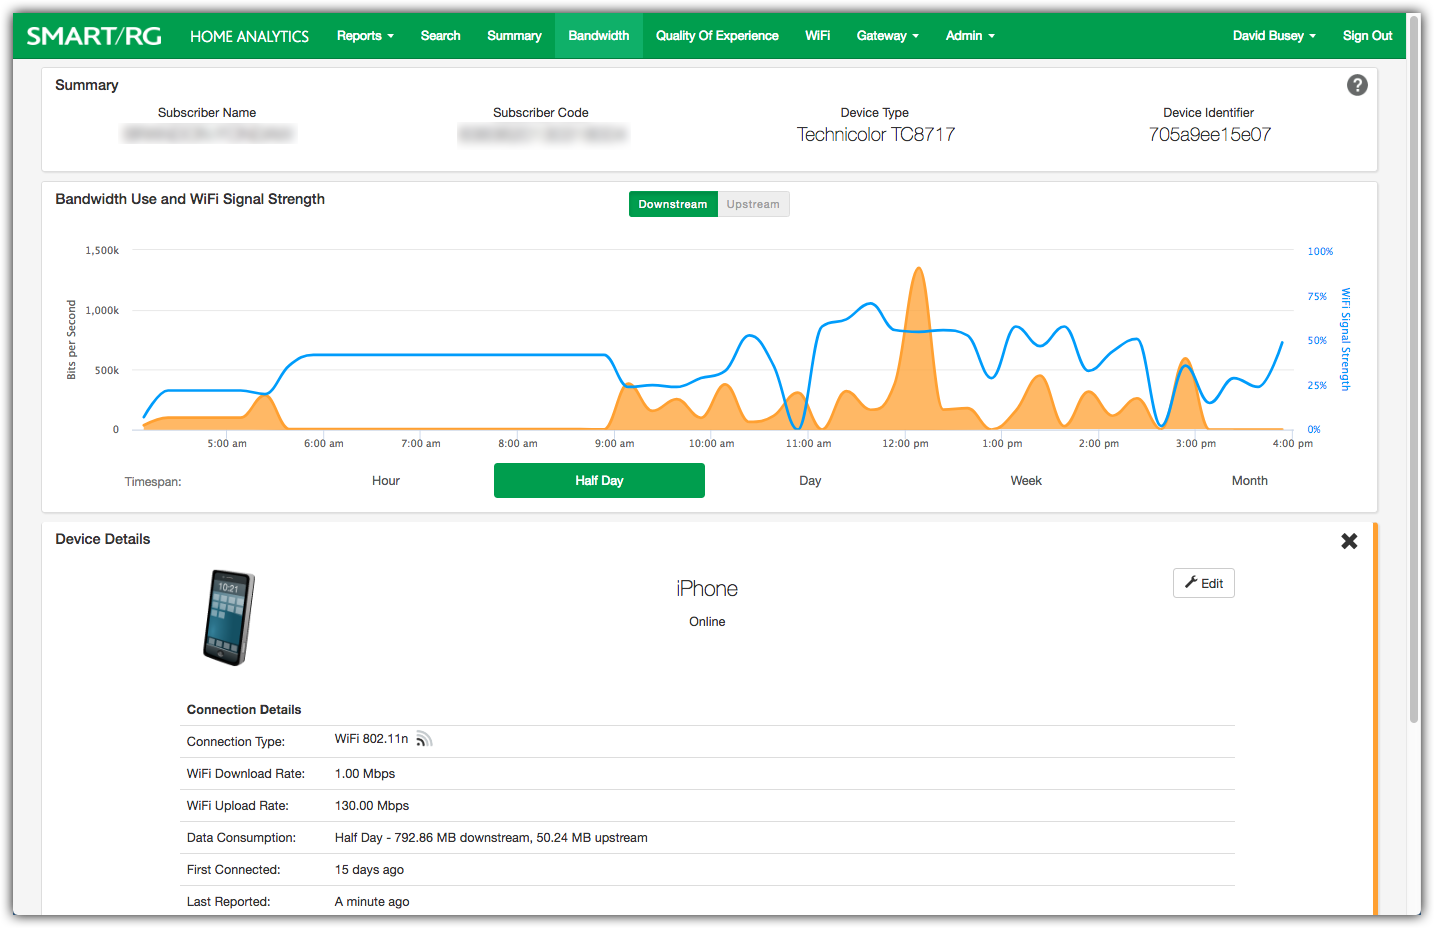
Bandwidth Page for single LAN device
The line chart also displays the strength of the WiFi signal that is available for each device during the timespan displayed. The WiFi strength is displayed as a percent and is depicted as a blue line.
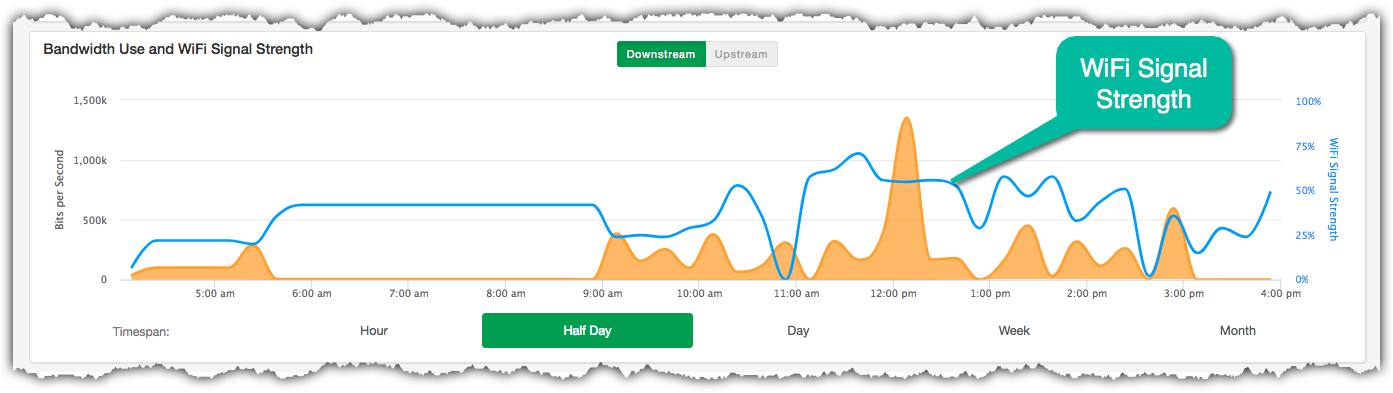
Bandwidth Use & WiFi Signal
The WiFi signal is also known as Received Signal Strength Indication (RSSI) and is derived from the perspective of what the Access Point (usually located inside the subscriber gateway) perceives looking toward the LAN device. It might not necessarily reflect what the subscriber can see from the perspective of their LAN device looking back toward the AP.
Device Details
Navigate to Device Details by clicking on a tile for a specific device. Revert to the previous view by clicking the x in the upper-right corner of the Device Details panel.
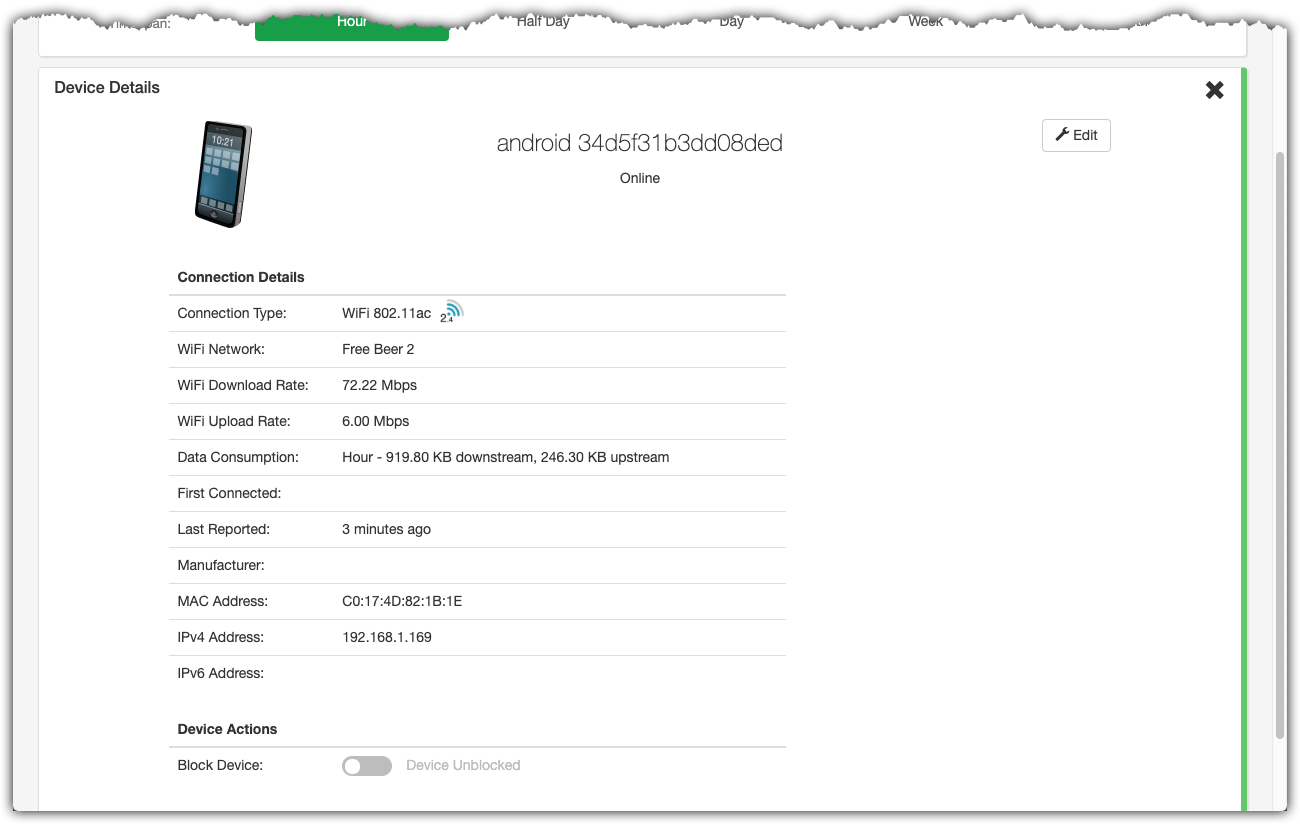
The following information about the device is revealed.
| Connection Details | Description |
|---|---|
| Connection Type | Distinguishes WiFi vs. Ethernet. Also displays the WiFi Operating Standard: a, b, g, n and ac |
| WiFi Network | The SSID name of the wireless network to which this device is attached. |
| WiFi Download Rate | Available bandwidth from the Access Point (gateway) to the device |
| WiFi Upload Rate | Available bandwidth from the device to the gateway |
| Data Consumption | Provides the sum total of bandwidth consumed for both upstream and downstream for the timespan selected |
| First Connected | Shows when first this LAN device first appeared on the LAN. (Up to three months into the past.) |
| Last Reported | Last time the gateway saw any traffic from this LAN device |
| Manufacturer | Name of LAN device manufacturer |
| MAC Address | MAC address of this LAN device |
| IPv4/IPv6 Address | IP Addresses of this LAN device |
Device Details Panel
Device Actions: Block Device
Beneath the Device Details table is the Block / Unblock switch (as seen in the image above). Toggle this switch to restrict or permit this client device to access the network.
Video Tutorial
RELATED ARTICLES: