Quality of Experience Report
To access the Quality Of Experience report, click the Reports drop-down menu near the top-left of the screen, then select Quality of Experience.
Quality Of Experience (QoE) is an index of home internet performance developed by ADTRAN, Inc. and takes into account the following metrics related to your subscriber’s internet experience:
- WiFi RSSI
- Free RAM
- Percent of CPU Utilization
- Device Uptime
This performance scale ranges from 0 to 5. A QoE rating of 5 would indicate perfect and optimal performance while a QoE rating of 0 would indicate very poor and potentially unusable performance.
Shown in this dynamic report are subscriber's CPE devices whose quality of experience metrics meet the thresholds you specify using the sliding controls in the column to the left. Not only is the Overall Score displayed for each subscriber but also a breakdown of the individual metrics (listed above) and their individual scores. These individual scores for CPU Percent Score, Free RAM Score, WiFi Score and Avg. Max Uptime Scoreare used to calculate the Overall Score.

Quality of Experience Report
The WiFI Score (based on RSSI) is the most heavily weighted metric used in deriving the QoE Overall Score. Other metrics are weighted significantly less in deriving the overall QoE score. See below for details on the calculation methodology.
Navigation Basics
Customize the report
To adjust the filter for any of the QoE scores, use the sliding controls in the column to the left. Simply click the blue doughnut at either end of the blue line and drag to the left or right to adjust the filtering thresholds. The data to the right will instantly reflect your filtering specification upon releasing the mouse button.

Slider controls for report filtering
Max LAN Devices
Beneath the slider controls you'll find a means to filter on the number of LAN devices present. If you're looking for performance data in networks of a certain size, specify the range by typing whole numbers into the min and max boxes. For example, if you wish to filter the results to show only Local Area Networks having between 10 and 20 LAN clients present, enter 10 in the Min text box and 20 in the Max text box.
View a single subscriber
To focus the report on a single subscriber, enter their Device Identifier in the Search box near the upper-left of the screen.
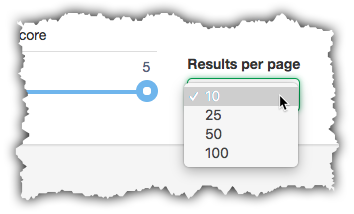
How many results per page
Customize how many line items from the report appear on a single screen using the Results Per Page drop-down near the lower-left of the screen.
Learn more about the results
Click on any line item in the report to drill down on an individual subscriber in order to further study their WiFi performance, physical status of the gateway or any other views that may assist you in root cause discovery of less than desirable performance.
Export the results
Click the Export CSV button in the lower-right if you require further study of the data in a spreadsheet or other third party database tool.

This feature exports the data to a CSV formatted file on your local drive which can then be imported to your application of choice.
Use Cases
The QoE report is intended for proactive discovery regarding the state of the quality of your subscriber’s internet experience. Use this tool to find issues before your subscriber contacts customer care. When an undesirable score is noted, you’ll want to further research the source of the problem using the other available tools within the Home Analytics platform and any other available resources in order to mount a more informed and effective corrective action. The additional intel available from this page provides for the potential of increased customer satisfaction through early detection and resolution of service issues. Below are just a few of the potential use cases for this QoE reporting tool.
Finding subscribers experiencing a poor overall QoE Score
- Click on the Overall Score heading to sort the column to ascending order. When the ^ appears near the name of the column header, the lowest WiFi scores are listed first.
- Drag the right end of the blue WiFi Score slider toward the left to a setting of 2.5.
- Drag the left end of the blue WiFi Score slider toward the right to a setting of .1.
When you come upon a low Overall Score in the report, it is likely that one of the metrics shown in the adjacent columns is mostly responsible for bringing down the Overall Score for that device. Use those adjacent scores to drive your next steps to research the WiFi or gateway physical health issues to better understand the poor Overall Score for a particular CPE device.
Finding subscribers experiencing poor WiFi performance
To find subscribers experiencing potentially questionable WiFi performance, set the filtering sliders at left as follows:
- Click on the WiFi Score heading to sort the column to ascending order. When the ^ appears near the name of the column header, the lowest WiFi scores are be listed first.
- Drag the right end of the blue WiFi Score slider toward the left to a setting of 2.5.
- Drag the left end of the blue WiFi Score slider toward the right to a setting of .1.
Finding subscribers experiencing poor CPU performance
If you become aware that there is an issue with devices with high percentage of CPU utilization, you can use this interface to reveal all of the affected CPE devices using this interface.
Set the filtering sliders at left as follows:
- Click on the CPU Percent Score heading to sort the column to ascending order. When the ^ appears near the name of the column header, the lowest CPU performance scores are listed first.
- Drag the right end of the blue CPU Percent Score slider toward the left to a setting of 2.5.
- Drag the left end of the blue CPU Percent Score slider toward the right to a setting of .1.
Finding subscribers experiencing poor Free RAM performance
To find subscribers experiencing potentially questionably high RAM utilization performance, set the filtering sliders at left as follows:
- Click on the Free RAM Score heading to sort the column to ascending order. When the ^ appears near the name of the column header, the lowest RAM performance scores will be listed first.
- Drag the right end of the blue Free RAM Score slider (located to the left of the report) toward the left to a setting of 2.5.
- Drag the left end of the blue Free RAM Score slider (located to the left of the report) toward the right to a setting of .1.
What happens next?
Upon setting the filtering sliders for any of the above scenarios or others of your own design, the system then queries and displays the first 100 subscribers bearing the performance attributes you’ve specified. One by one, you’ll want to pursue additional discovery with the goal of understanding the cause of poor performance for each affected subscriber, then take the appropriate corrective action.
How QoE is Calculated
Daily, at a pre-determined time, an agent retrieves QoE metrics from the Home Analytics database (average max uptime, WiFi signal strength, uptime, CPU load, free ram, etc.). These are retrieved for all devices but can be thought about on a per device level.
If no metrics are found for a given CPE device, a score of 0 is applied and the device is included in the report. In the near future, devices scored with 0 will be instead filtered from appearing in the report as a lack of metrics implies that the device was not online during the reporting interval being tallied.
NOTE: The score for average max uptime QoE is determined once daily by an agent scheduled separately than mentioned above. The most recent Time Between Restarts QoE score is used in the aggregate score. This means an additional day of history is included to derive the former time between restarts score to influence the overall QoE score for a device.
How is the Overall Score and Aggregate Score determined?
Definitions:
| Aggregate Score | (Seen on the Dashboard Report in the second tile from the left) is the mean of all of the Overall Scores for all CPE devices in the population reporting data. | ||||||||||
| Overall Score |
The weighted average of the QoE metrics tabulated for a single CPE device. The individual metrics are weighted as per the table below.
|
If more than one score of a particular type is found in an interval, both scores are used and both weights applied. To make the avg. max uptime more weighted, it is also multiplied by the max count of the other individual items (wifi, cpu, or free ram). For example, if the elements to be aggregated into a single time interval were...
wifi → 4.2, wifi → 3.9, cpu → 4.9, cpu → 4.8, free ram → 2.1, free ram → 2.2, avg max uptime → 3.4, the resulting calculation would look like this:
4.2 * 40 + 3.9 * 40 + 4.9 * 10 + 4.8 * 10 + 2.1 * 5 + 2.2 * 5 + 3.4 * 40 * 2 / (40 + 40 + 10 + 10 + 5 + 5 + 40 * 2) = 714.5 / 190 = 3.8 (rounded to nearest tenth)
Note that this example is somewhat simplified from the reality of a true, production situation. Typically there will be many more scores for a single device in a 24 hour period, which is the non-daylight saving period used to determine the per-device quality of experience.
RELATED ARTICLES:
Subscriber Quality of Experience