Using The WiFi Page
From the Network drop-down list at the top of the screen, select WiFi to navigate to this display.
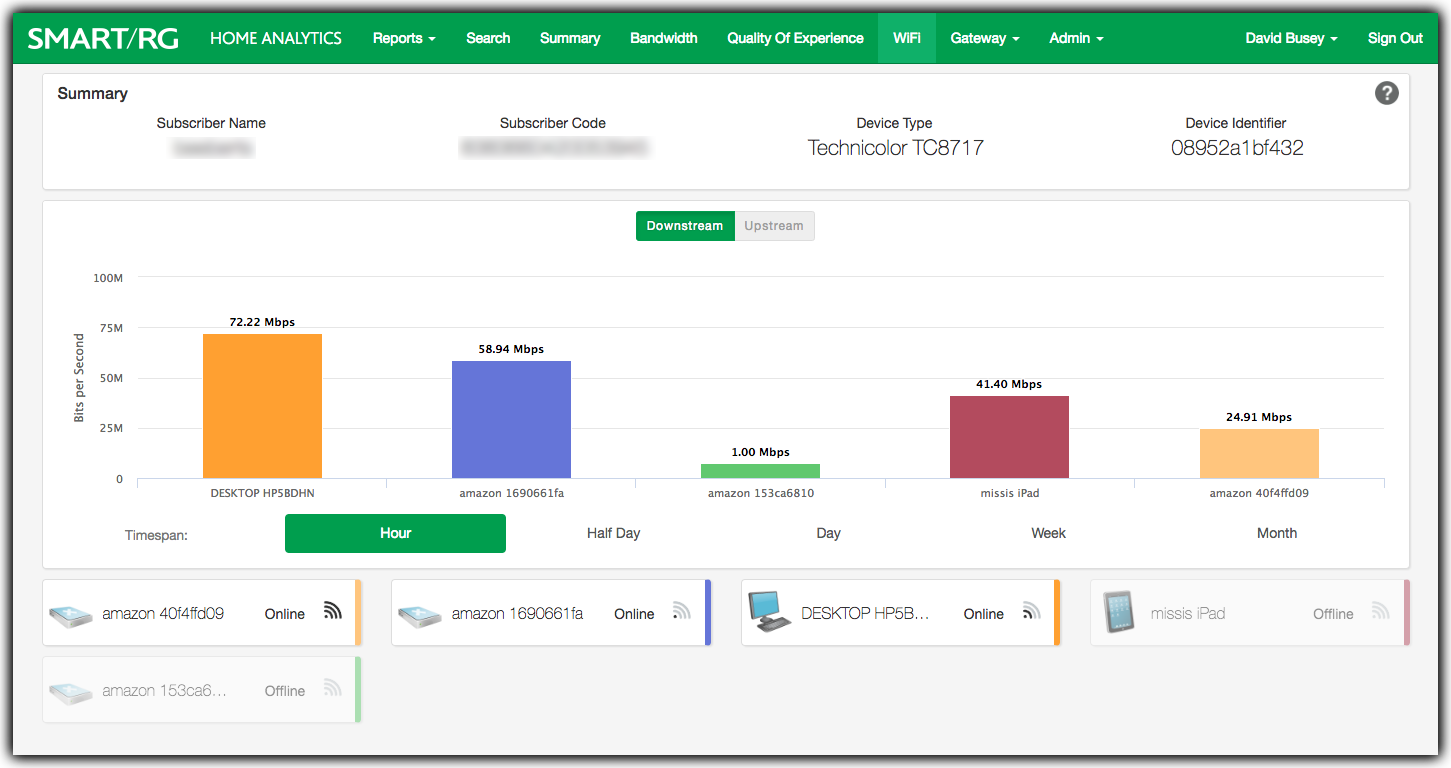
Average WiFi Data Rates per LAN device
Summary Panel
The content of the top panel is a static display of the subscriber details including Subscriber Name, Subscriber Code, Device Type and Device Identifier. This panel remains constant no matter which page you navigate to and will update when you search for a different subscriber. This can be useful to confirm that you are looking at the correct gateway.
WiFi - Average Data Rates
This panel shows the average available WiFi date rates for each device over a configurable time period (hour, day, week, etc). This information is displayed as a bar chart with each device represented a different color.
Very low average data rates for a device can indicate problematic performance and is likely related to what prompted your subscriber to call for assistance. This extremely visual glance of the data rate health for each device speeds problem identification and time to resolution making support center agents more productive. Swift resolution also makes for happier subscribers that can get back to enjoying their connected lifestyle.
Clicking on the Device tile or the corresponding bar in the bar chart opens a screen dedicated exclusivity to that LAN device.
If single device data is already being displayed, click the x in the upper right of the Device Details panel to reveal the list of all devices. Select from the device tiles to drill-down and study single device stats as desired.
Hover your mouse over any point along the timeline to reveal the tooltip containing performance details from that moment in time.
Use the Timespan buttons just below the chart to view statistical snapshots from different periods of time. Use the Month button to view an entire month of activity. Select Week, Day, Half Day, or Hour to zoom in and view the telemetry for lesser periods.
There is also a second method to zoom in and reveal detail for a shorter span of time. Click-and-drag your cursor across a portion of the chart. The chart zooms to fill the width of display with the time period you specified. Click Reset Zoom near the upper-right to return to the previous time span you selected using one of the Timespan buttons.
Using either method, any selected period representing less than 24 hours reveals 5 minute interval resolution -- the finest detail available from the platform.
WiFi - Signal Strength
The WiFi line chart displays the strength of the WiFi signal for that device.
- The WiFi strength is expressed as a percentage of the whole and is depicted as a blue line. See the vertical legend for WiFi Signal Strength at the right edge of the chart.
- The data rate is represented by the colored line (corresponding to the device's color strip). Note the vertical legend for bits per second at the left edge of the chart.
The position of the two lines relative to each other is not meaningful.
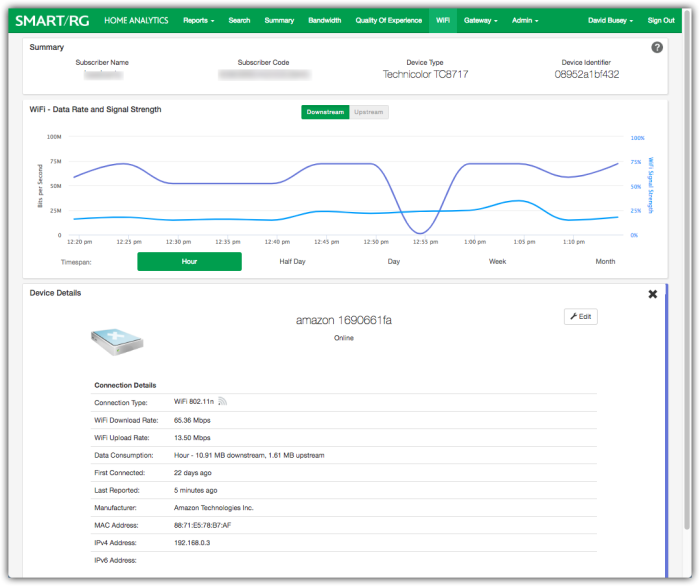

WiFi Data Rates and Signal Strength
The following information about the device is revealed in the table located in the lower portion of the screen under Device Details:
| Connection Details | Description |
|---|---|
| Connection Type | Distinguishes WiFi vs. Ethernet. Also displays the WiFi Operating Standard: a, b, g, n and ac |
| WiFi Download Rate | Available bandwidth from the Access Point (gateway) to the device |
| WiFi Upload Rate | Available bandwidth from the device to the gateway |
| Data Consumption | Provides the sum total of bandwidth consumed for both upstream and downstream for the timespan selected |
| First Connected | Shows when first this LAN device first appeared on the LAN. (Up to three months into the past.) |
| Last Online | Last time the gateway saw any traffic from this LAN device |
| Manufacturer | Name of LAN device manufacturer |
| MAC Address | MAC address of this LAN device |
| IPv4/IPv6 Address | IP Addresses of this LAN device |
Device Details Panel
NOTE: This content of this table is identical to the Device Details displayed on the Bandwidth page.
Video Tutorial