Uptime Report
The purpose of the Uptime Report is to highlight the top 100 monitored devices experiencing poor performance, by displaying uptime statistics for each device. Use this report to proactively resolve a subscriber's service issue before they call customer care.
To help ensure this report provides meaningful device uptime insight, the following filtering is applied:
- Devices that have not reported in over 8 days are not included in this report.
- Current uptime is factored into the average if a device has been up for more than 24 hours.
To access the Uptime Report, click on the Reports drop-down at the left of the horizontal menu bar then select Uptime.
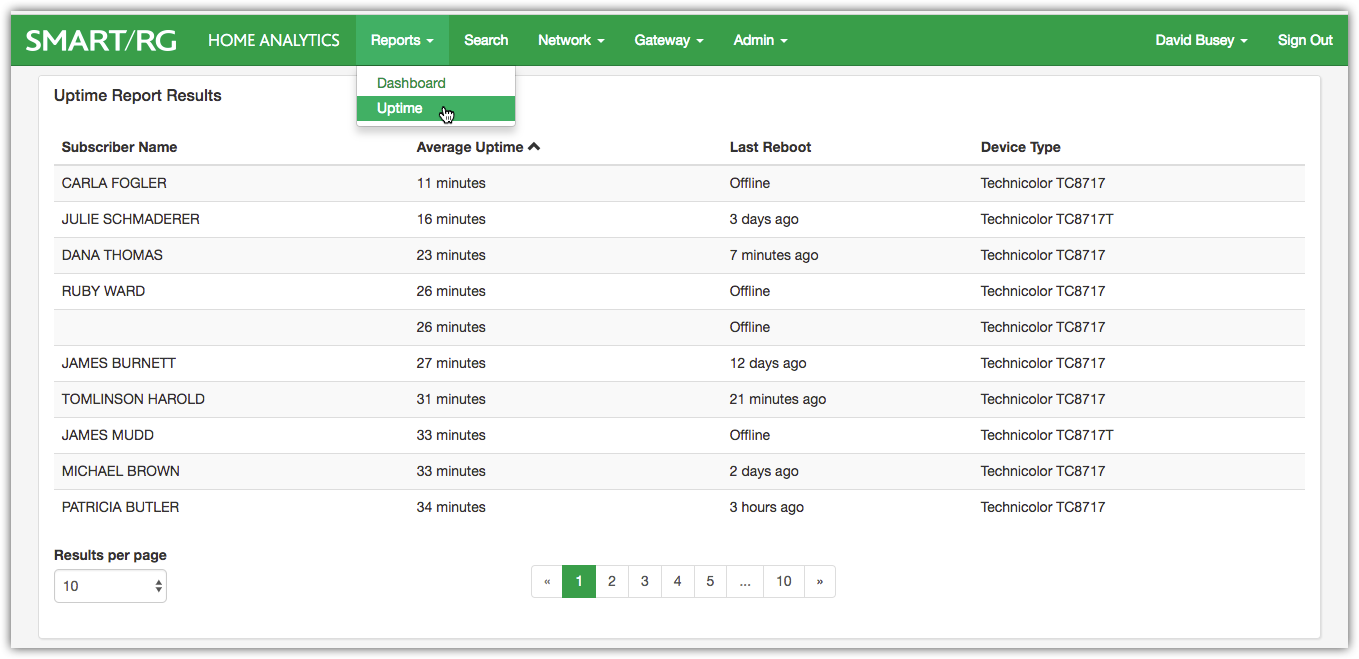
The columns displayed in this report are Subscriber Name, Average Uptime, Last Reboot and Device Type.
By default the report is sorted in by the Average Uptime column in ascending order. Click any colum header to change the sorting for the report. Click the column header a second time to toggle the sort from ascending to descending order.
Click on a row to link to the Summary page for that subscriber.
Here is a description of the data columns found in this report:
| COLUMN NAME | DESCRIPTION |
|---|---|
| Subscriber Name |
The name of subscriber associated with the poorly performing device. |
| Average Uptime | Calculated from data captured from the last 13 reboots* of the device, this column displays the average time the device was up and functioning between these reboots. The average uptime between reboots is weighted toward the uptime associated with the most recent reboots. Devices shown to be rebooting frequently are an indication of poor performance and some action (such as troubleshooting or replacement) may be warranted. |
| Last Reboot | Elapsed time since the most recent reboot of this device. |
| Device Type | The gateway manufacturer and/or model of the subscriber's device. |
* While the most recent 13 reboots is the upper bound for the calculation, potentially problematic devices appearing in this report have experienced a minimum of 5 reboots.