The Summary Page
To access the Summary page, select a subscriber from the Search page or select Summary from the Network drop-down menu at the top of the page.
This page provides a graphical overview of the selected subscriber's home. As with all the other pages, this display will automatically refresh at regular intervals with updated information. Note that the URL found in the Address bar of your browser changes to be subscriber-specific and can be shared if needed.
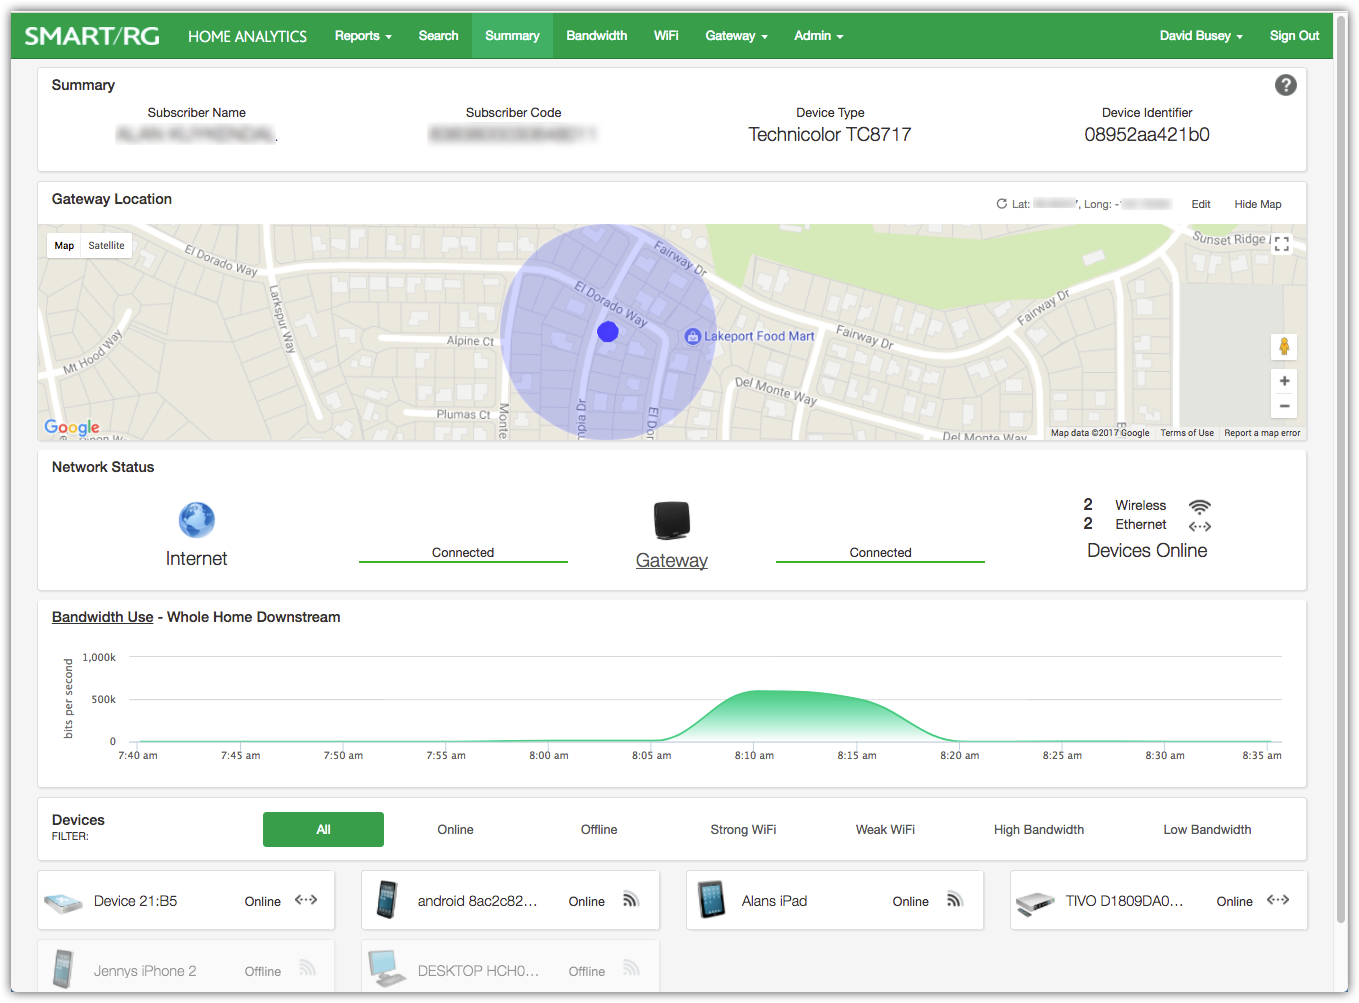
Summary Page
Summary Panel
The content of the top panel is a static display of the subscriber details including Subscriber Name, Subscriber Code, Device Type and Device Identifier. This panel remains constant no matter which page you navigate to and will update when you search for a different subscriber. This can be useful to confirm that you are looking at the correct gateway.
Gateway Location
This feature is powered by a third party location service that collects location data from devices where any associated radios (cell site or WiFi access point) have known GPS location data. The WiFi Site Survey data for the subscriber’s gateway is submitted to this same location service which then, using all available data, attempts to triangulate the location of the subscriber’s gateway. When successful, the service returns an estimated latitude/longitude for the subscriber’s gateway within a certain tolerance of precision.
The coordinates received are displayed on a street map along with the tolerance for precision indicated by a shaded circle.
On occasion, the location service doesn’t have enough data for successful triangulation. In these instances, no map will appear in this panel and the following controls are available toward the right edge of your screen.
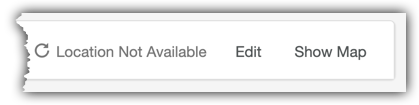
In the event that location information does not appear, consider using one of the following options:
REFRESH
Press the refresh circular arrow icon to re-send the WiFi Site Survey data to the location service. This may or may not result in successful triangulation of the subscriber's gateway.
EDIT
If latitude and longitude coordinate information for this subscriber are known, click the Edit button and enter the coordinates. A street map showing the location you have manually provided will appear.
Network Status
This panel begins with a display of the connectivity status of each leg of the connection:
- From the LAN devices to the gateway
- From the gateway to the internet (the provider)
The status for each leg of the connection could be described as Connected or Not Connected. At the far right is the number of LAN devices connected by Ethernet cable (hard-wired) and the number of LAN devices connected via WiFi.
In addition, the system may assess more specific performance issues with the CPE device beyond the simple connection status described above.
The Home Analytics platform monitors performance in the areas of WiFi RSSI, RAM utilization, CPU utilization and CPE device uptime. Questionable performance in these and other areas are called out and paired with a suggestion for corrective action as shown in the sample scenario illustrated below.
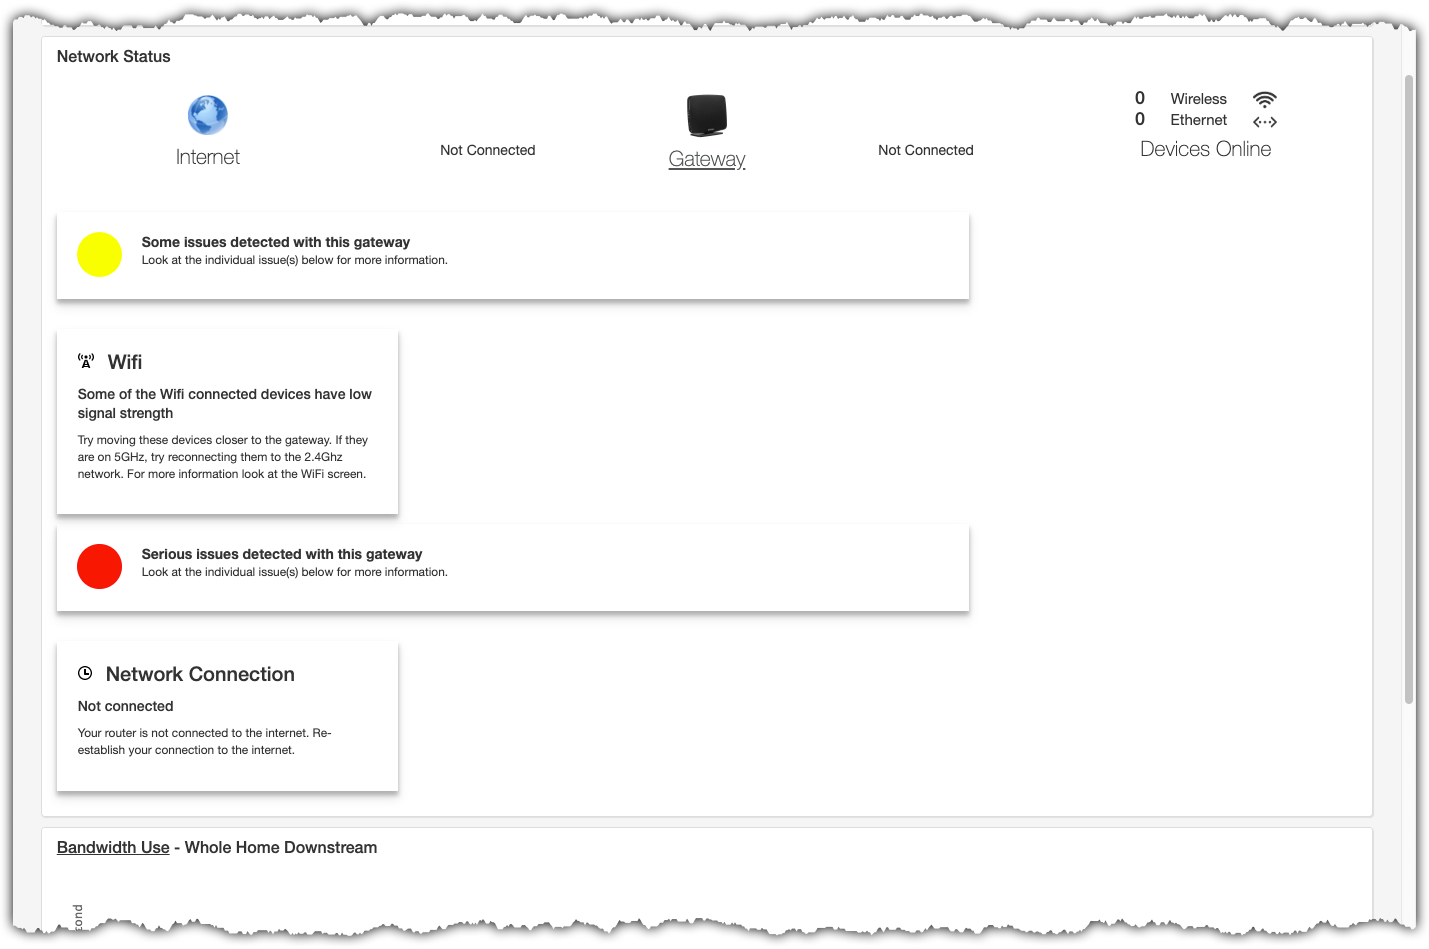
Summary Page
When present, the notifications are color coded as yellow to indicate a moderate severity and red to indicate the highest severity (typically a service affecting condition).
Bandwidth Use
In this panel, a graph displays the downstream data rate (Mbps) for the previous hour of operation of the gateway. This is an aggregate of throughput for all LAN devices connected to the gateway. This data point often provides a starting point for troubleshooting.
Hover your mouse over any point along the timeline to reveal the tooltip containing performance details from that moment in time.
NOTE: To zoom in and see additional detail for a shorter span of time, click-and-drag your cursor across a portion of the graph. The graph zooms to fill the width of display with the time period you specified. To return to the default time span, click Reset Zoom.
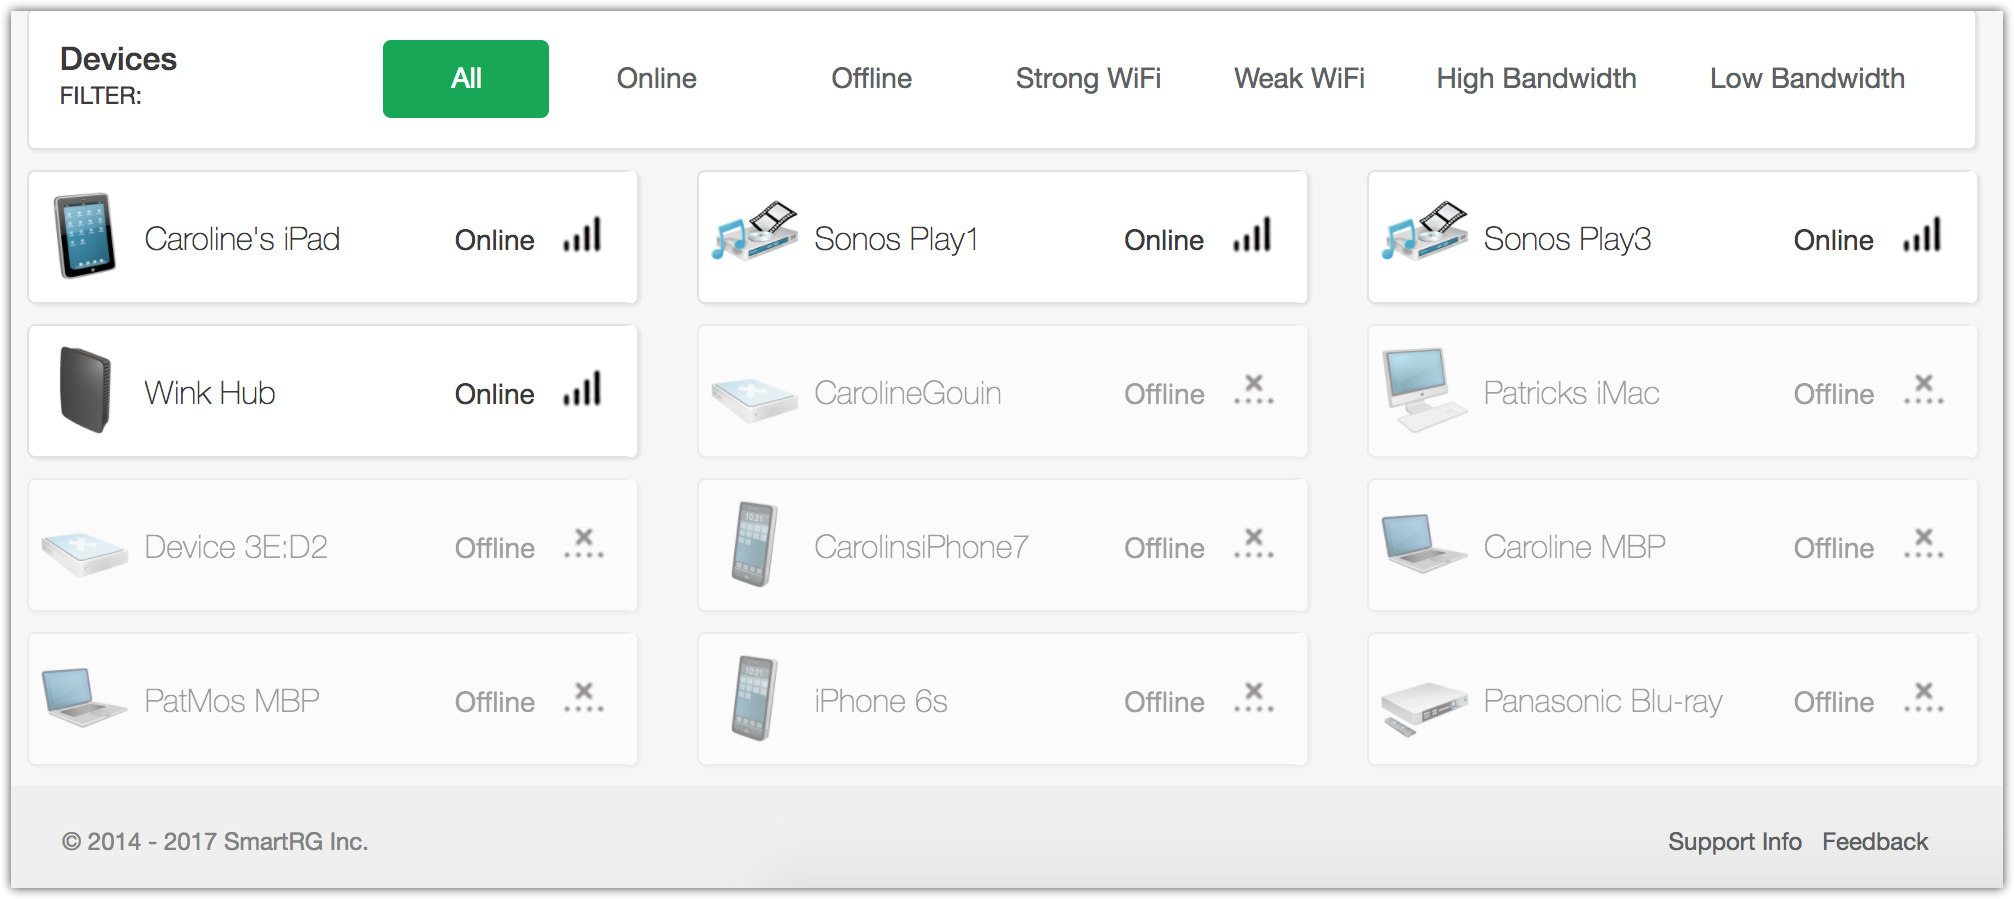
Devices Filter
This panel provides a series of buttons used to filter the list of devices below.
Click All to see all LAN devices that connected to this gateway at any point over the last month. (Anything older is not displayed.) You can filter this list with the remaining links to the right.
| FILTER NAME | RESULT |
|---|---|
| Online | Show devices currently connected to the subscriber's gateway |
| Offline | Show devices currently NOT connected to the subscriber's gateway |
| Strong WiFi | Show devices exhibiting a weak WiFi signal strength |
| Weak WiFi | Show devices exhibiting a weak WiFi signal strength. |
| High Bandwidth | Show only devices using a significant portion of the subscriber's bandwidth |
| Low Bandwidth | Show only those LAN devices using a minimal portion of the subscriber's bandwidth |
Options for filtering which device tiles are displayed
NOTE: These filters do not affect the graph above, but rather provide a clearer picture of which devices, if any, may be performing in an undesirable fashion.
Clicking on an individual device tile links to the Bandwidth page for that device.
Devices Filter